Download
1 / 15
150 likes | 290 Vues
This document presents an overview of advanced radar imaging techniques employed by the Byrd Polar Research Center and The Ohio State University in collaboration with NASA's Jet Propulsion Laboratory and other institutions. The project focuses on mapping Greenland and Antarctica's ice sheets to assess mass balance and monitor sea level rise. Utilizing systems like GISMO, WISE, and Lidar, the initiative aims for high-accuracy ice thickness measurements, improving ice dynamics models, and enhancing predictions regarding ice response to climate changes.

E N D
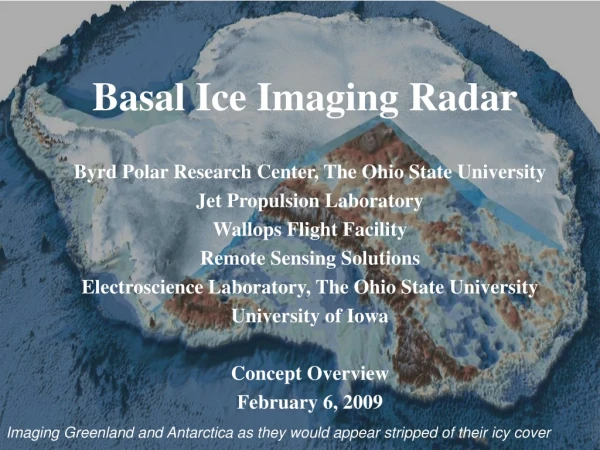
Basal Ice Imaging Radar Byrd Polar Research Center, The Ohio State University Jet Propulsion Laboratory Wallops Flight Facility Remote Sensing Solutions Electroscience Laboratory, The Ohio State University University of Iowa Concept Overview February 6, 2009 Imaging Greenland and Antarctica as they would appear stripped of their icy cover
Ice Sheet Mass Balance and Sea Level • Ice sheet mass balance is described by the mass continuity equation Altimeters Act/Pass. Microwave Obtaining ice thickness data around the perimeter of the ice sheets remains a primary goal of the ice sheet science community (ISMASS) InSAR Evaluations of the left and right hand sides of the equation will yield a far more complete estimate of the current contribution of ice sheets to sea level rise. Moreover, unique, 3-d imagery of the base will substantially improve ice dynamics modeling enabling better predictions of the future response of ice sheets to global climate change
Science Requirements • 2 m vertical ice sheet surface height accuracy – across the radar swath • 10 cm vertical ice sheet surface height accuracy – along laser scan for radar calibration and comparison with ICEsat • 20 m vertical ice sheet base height accuracy for all ice covered terrain • 20 m vertical accuracy on radar internal layers for ice dynamics • 25 m geolocation accuracy (WGS 84/polar stereographic projections) • Relative radiometric accuracy sufficient to discriminate basal rock from basal water • 50 m pixels • Continuous coverage with 100 km swath from grounding lines for both Greenland and Antarctica. • Capability for 5-10 year repeat of integrated measurements for mapping redistribution of subglacial water (post Ventures addition to baseline measurement of topography) • Data products to be integrable with DESDynI surface velocities and ICEsat surface topography 1st UHF image of ice sheet surface
Team Organization PI (Ken Jezek) Product validation & modeling (K. Jezek) Operations Management (TBD) Project management (TBD) Science team Ernesto Rodriguez - interferometry William Krabill - Surface elevation change David Holland - ocean-ice sheet modeling Christina Hulbe - numerical ice sheet modeling Richard Hindmarsh - ice dynamics modeling Joel Johnson – radar scattering modeling Aircraft management (RSS) System operations (RSS) Payload system engineering (G. Sadowy) Product development (X. Wu, A. Safaeinili, J. Sonntag) WISE (A. Safaeinili) GISMO (X. Wu) LIDAR (B. Krabill) Product distribution (Byrd, OSU) Radar (B. Heavy, JPL) VHF Antennae (Volakis & Chen, OSU) Low Frequency Antenna (Kurth, Kirchner, Iowa) Digital subsystem (Carswell,Moller, RSS)
Measurement Concept • Three systems working together • GISMO (Glaciers and Ice Sheet Mapping Observatory) radar (150-450 MHz) to map both surface and bottom of 3D topography of ice sheets • WISE (JPL radar 1 – 20 MHz) to provide nadir depth sounding measurements of ice thickness for warmer and fractured ice • WFF Lidar to provide accurate surface profile for elevation change detection to complement ICEsat and to provide validation for WISE and GISMO Lidar GISMO antenna hook up GISMO GISMO antenna hook up Lidar antenna hook up WISE antenna hook up WISE
parallel-pattern transverse pattern 120MHz 25” 120MHz Payloads: WISE, GISMO, LIDAR Airborne Topographic Mapper Basal topography sensed using multi-antenna tomographic SAR measurements at 150 MHz. New antenna and receiver systems to: Extend GISMO 20 MHz bandwidth to 100 MHz Reduce horizon gain of GISMO antenna to eliminate late time surface clutter WISE radar (demo version) full-scale EM simulation OSU miniature planar UWB antenna element
Radar System Block Diagram GISMO transmit antenna array • Leverages GISMO and WISE designs • Integrates both systems with a common controller and data system • Also provides synchronization timing for WFF lidar system • Full digital signal processing on both transmit and receive • Three waveform generators • Twenty digital receivers • Real-time processing for data volume reduction • All solid-state transmitters • Design based on JPL’s WISE radar and Europa Sounder with negligible risk to build Transmitter WISE antennae Receiver GISMO receive antenna array
RSS Digital Receiver & Data Acquisition • RSS Team Brings … • Remote Sensing Systems Experience: Developing end to end solutions for airborne remote sensing from manned and unmanned aircraft since 1990. • Broad Experience: 20+ yrs in developing data acquisition & management, embedded systems, • radar digital receiver & processing, processor and real-time operational data system solutions. • FPGA-based Digital Receivers: Developing state of the art, high performance, multi-channel • airborne FPGA digital receiver solutions since 1998 for manned and unmanned platforms. • Full Demonstration & Developing Environment: Hardware and software development boards • and software to mitigate risk. • Leverage RSS Receiver and Data System Technology • - Multi-channel Digital Receiver: Can support BIIR requirements. • - Novel System Architecture: Supports up to 16 receiver channels, • 25+ Gb/s processing bus and 10 Gb/s CompactPCIe bus 3rd party support. • - Embedded Network Processor: Provides multiple independent Gigabit • Ethernet interfaces for real-time access to data & system and a means for • efficient data distribution on ground. • Utilize AAMPS Framework: Novel network-based, remote access, real-time • data acquisition, control, distribution & visualization system developed for • NOAA research aircraft. Conduction Cooled 3U PCIe System Virtex-5 Multi Channel Digital Receiver Embedded Network Processor
Obtain 3-dimensional imagery of ice sheet surface and base by increasing level of complexity • Phase 1: 10 selected glacier basins in Greenland and Antarctica • Phase 2: 100 km strip from grounding line • Post Ventures: complete coverage • Logistical requirement • 5 hours per glacier system (500 km/hour, 10km swath) • 1300 hours to cover 100 km strip about Antarctica from the grounding line • 400 hours to cover 100 km strip about Greenland • Conservative data collection cost estimate: <$20 M for phase 1 and 2 with 100% overhead and assuming $5K/flight hour Operational Objectives selected glaciers major aircraft stations Halley Bay Thule South Pole Dome 'C’ Byrd Sondrestrom McMurdo Dumont D'Urville
Platform options & Operating Concept • Platform options • Use available planes for early phase • Ken Borek Air Twin Otter or NASA Wallops P-3 for Greenland • Twin Otter or Air National Guard C-130 for Antarctica • Wallops encourage BIIR use of P-3 • Unsolicited proposing that NSF recommission one of their Hercules C-130 planes for later phase. • UAV possible but unlikely because of altitude and operational complexity • Cycle GISMO, ATM, and WISE to avoid interference from simultaneous operation • Fly over target area and collect return signals at on-board Operations Center • Ocean flight calibration. • Validation using existing data sets and cross flights. • Real time on-board processing, on-field processing and post processing. DAC January 2009
Final Product Deliverables to Science Community • Ice thickness maps • Surface/base topography/intensity maps • Bed rock/water classification maps • Multilook azimuth compressed images • Basal layer roughness and correlation length maps • Internal layer images • Google earth interface to final products, flight lines • and raw data sets Surface intensity map 3D base topography and intensity Base image mosaic
Multi-frequency images of ice sheet surface across Jacobshavn glacier Lake Crevasse Band Ice stream 24 km 7/20/2008, 150 MHz GISMO Nov/Dec 2000, C-band Radarsat 7/15/08, MERIS optical image 17 km July 20, 2008, 17 km wide, 150 MHz radar tomography GISMO image (geocoded) of the upper surface of the ice sheet across Jacobshavn Glacier (right). 2000 Radarsat C-band image (center). Inset map from Radarsat mosaic (left). July 15, 2008, MERIS optical image (lower left). GISMO image located at about 69.3N, 48.3 W
Data processing scheme WISE raw data LIDAR raw data GISMO raw data Range compression Multi-squint sounder processor LIDAR processor Calibration GISMO processor WISE processor Data fusion processor Beam Steering surface clutter rejection Ice thickness data Surface topography/intensity archive Base topography/intensity archive • Tomography/interferometry processor: • Left - right separation • Topography estimation • Amplitude estimation Orthorectification Image mosaic Bed rock/water classifier Processing time requirements can be met by commercially available, low cost (<$100K), multiprocessor architectures Ice thickness maps Surface/base topography/intensity maps Bed rock/water classification maps
Products and Information Flow Final product archive: Ice thickness maps Surface topo/intensity maps Base topo/intensity maps Water/rock classification maps Multilook azimuth compressed images Basal layer roughness and correlation length maps Internal layer images Google earth interface to final products, flight lines and raw data sets (20 GB) Intermediate products: (not archived) Range compressed data Single look azimuth compressed data Raw data Archive (380 TB) General public Science community • Only raw data and final products are archived. • Raw data will be available to science community per request. • Intermediate products including range compressed data and single look azimuth compressed data are not archived. But they will be available after reprocessing to science community per request. • Conservative estimate of storage disk cost: $500K. • Data distribution heritage from Radarsat Antarctic Mapping Mission: http://bprc.osu.edu/rsl/radarsat/data/
Summary • The measurement is one-time shot due to the slow change of the bedrock elevation. It will stand as a reference climatological baseline. • The technology is mature and proven. Radar system build is low risk (commercial or existing parts) and leverages JPL heritage. • Unique ice thickness measurement directly complement DESDynI and ICESAT observation of surface velocity and surface elevation change • Issues to be resolved during proposal phase: • Installation of antennas (e.g. NYANG 109th airforce flight worthiness restrictions) • Logistical capabilities around Antarctica • Instrument integration • Supplement instruments (gravimeters) • Potential Partners • ESA has expressed possible interest in co-funding deployments as well as providing additional radar now supporting BIOMASS related experiments • OPP/NSF C-130 logistics in Antarctica (e.g. fuel) • Costs: Conservative estimate of costs in order of ~$30M