1.0
A. B. C. P gdh ipct/dipps. ipct/dipps. up-trpE. 1. 2. 1. 2. 1. 3. M. 10.0. 8.0. 6.0. 5.0. 4.0. 3.0. 2.5. 2.0. DNA size marker (kbp). 1.5. 1.0. 0.8. 0.6. 0.4. Borges et al. Supplemental Material.

1.0
E N D
Presentation Transcript
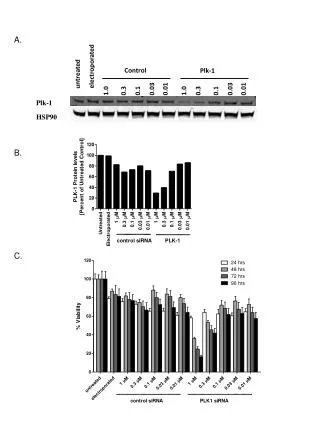
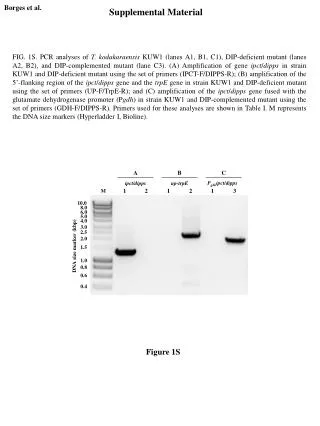
A B C Pgdhipct/dipps ipct/dipps up-trpE 1 2 1 2 1 3 M 10.0 8.0 6.0 5.0 4.0 3.0 2.5 2.0 DNA size marker (kbp) 1.5 1.0 0.8 0.6 0.4 Borges et al. Supplemental Material FIG. 1S. PCR analyses of T. kodakaraensis KUW1 (lanes A1, B1, C1), DIP-deficient mutant (lanes A2, B2), and DIP‑complemented mutant (lane C3). (A) Amplification of gene ipct/dipps in strain KUW1 and DIP‑deficient mutant using the set of primers (IPCT-F/DIPPS-R); (B) amplification of the 5’‑flanking region of the ipct/dipps gene and the trpE gene in strain KUW1 and DIP‑deficient mutant using the set of primers (UP-F/TrpE-R); and (C) amplification of the ipct/dipps gene fused with the glutamate dehydrogenase promoter (Pgdh) in strain KUW1 and DIP‑complemented mutant using the set of primers (GDH-F/DIPPS-R). Primers used for these analyses are shown in Table I. M represents the DNA size markers (Hyperladder I, Bioline). Figure 1S