1.0
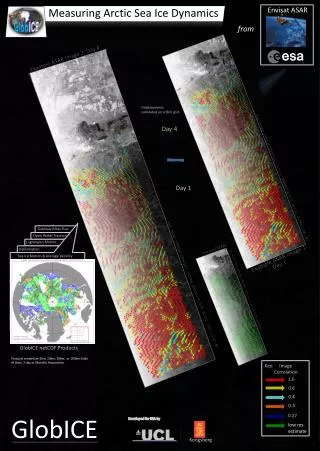
Envisat ASAR. Measuring Arctic Sea Ice Dynamics. from. Example ASAR Image 2: Day 4. Displacements calculated on a 5km grid. Day 4. Day 1. Gateway Mass Flux. Open Water Fraction. Quikscat /SSMI. Lagrangian Motion. Deformation. Example ASAR Image 1. Velocity.

1.0
E N D
Presentation Transcript
EnvisatASAR Measuring Arctic Sea Ice Dynamics from Example ASAR Image 2: Day 4 Displacements calculated on a 5km grid Day 4 Day 1 Gateway Mass Flux Open Water Fraction Quikscat/SSMI Lagrangian Motion Deformation Example ASAR Image 1 Velocity Sea Ice Motion & Average Velocity Average Velocity Day 1 ASA_WSM_1PNPDE20090102_232125_000002312075_00159_35784_1381.N1 62.5km Product from IFREMER used as an initial drift estimate GlobICE netCDF Products Products created on 5km, 20km, 50km, or 100km Grids At Daily, 3-day or Monthly frequencies Key: Image Correlation 1.0 0.6 ASA_WSM_1PNPDE20090102_232706_000002752075_00202_35827_5107.N1 0.4 0.3 0.27 GlobICE Developed for ESA by low res.estimate Kongsberg