Analysis of HMGA1 siRNA Knockdown Efficiency in Medulloblastoma Cells ONS76 and DAOY
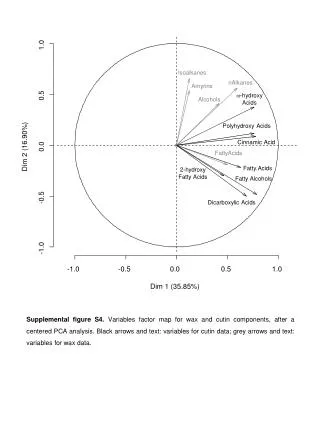
This study evaluates the effectiveness of HMGA1 siRNA knockdown in medulloblastoma (MB) cell lines ONS76 and DAOY. The left panel displays quantitative RT-PCR results indicating relative fold changes in HMGA1 mRNA levels following transfection with either HMGA1 siRNA or negative control siRNA. All samples were analyzed in triplicate and comparisons were made using the Student's t-test (p < 0.001). The right panel shows Western blot analysis results for HMGA1 and β-actin proteins in cell lysates, confirming the knockdown of HMGA1 in treated cells.

Analysis of HMGA1 siRNA Knockdown Efficiency in Medulloblastoma Cells ONS76 and DAOY
E N D
Presentation Transcript
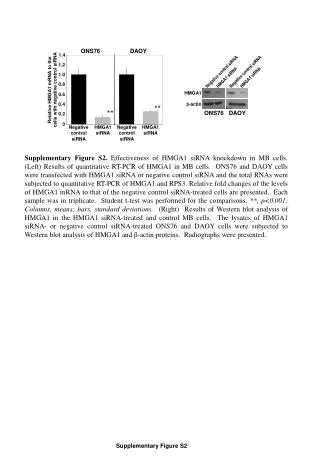
** ** Supplementary Figure S2. Effectiveness of HMGA1 siRNA knockdown in MB cells. (Left) Results of quantitative RT-PCR of HMGA1 in MB cells. ONS76 and DAOY cells were transfected with HMGA1 siRNA or negative control siRNA and the total RNAs were subjected to quantitative RT-PCR of HMGA1 and RPS3. Relative fold changes of the levels of HMGA1 mRNA to that of the negative control siRNA-treated cells are presented. Each sample was in triplicate. Student t-test was performed for the comparisons. **, p<0.001; Columns, means; bars, standard deviations. (Right) Results of Western blot analysis of HMGA1 in the HMGA1 siRNA-treated and control MB cells. The lysates of HMGA1 siRNA- or negative control siRNA-treated ONS76 and DAOY cells were subjected to Western blot analysis of HMGA1 and β-actin proteins. Radiographs were presented. ONS76 DAOY 1.4 1.2 1.0 0.8 Negative control siRNA Negative control siRNA Relative HMGA1 mRNA to the cells with negative control siRNA HMGA1 siRNA HMGA1 siRNA 0.6 0.4 HMGA1 0.2 β-actin 0 ONS76 DAOY Negative control siRNA HMGA1 siRNA Negative control siRNA HMGA1 siRNA Supplementary Figure S2