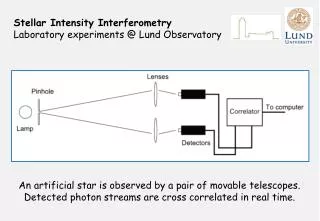
Laboratory experiments
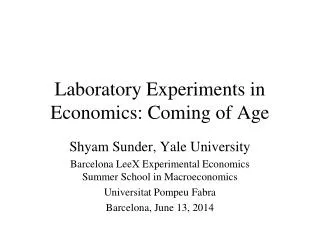
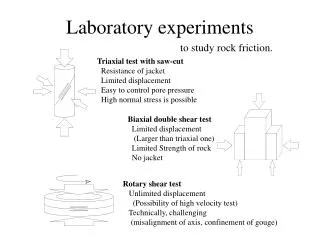
Laboratory experiments. to study rock friction. Triaxial test with saw-cut Resistance of jacket Limited displacement Easy to control pore pressure High normal stress is possible. Biaxial double shear test Limited displacement (Larger than triaxial one)

Laboratory experiments
E N D
Presentation Transcript
Laboratory experiments to study rock friction. Triaxial test with saw-cut Resistance of jacket Limited displacement Easy to control pore pressure High normal stress is possible Biaxial double shear test Limited displacement (Larger than triaxial one) Limited Strength of rock No jacket Rotary shear test Unlimited displacement (Possibility of high velocity test) Technically, challenging (misalignment of axis, confinement of gouge)
Rate- and state-dependent law Dieterich, 1979, Ruina, 1983 Velocity step test aln(10) bln(10) f ~ L a – b < 0 : Velocity weakening Figure from Marone, 1998 f0 : Reference friction coefficient V0: Reference slip rate θ: State variable and a state-evolution equation in various manners
Wide applicability of rate- and state-dependent frictional law Typically, decays occurs for displacement of tens of microns to 1mm. Dieterichand Kilgore 1994
Aging of a fault Slide-hold-slide test Dieterich, 1972 Sandstone Note: Cut off of this effect at low contact time is required. The strength can’t be –∞.
∂fss /∂ln(V), “a - b value” f NaCl Dieterich, 1978 Dry granite Shimamoto, 1986
Wet granite Δfss / Δln(V) Blanpied et al., 1991 Depending on the material, “a-b” is negative only in a limited range of T and V. Blanpied et al., 1995
Raw data and fitting to it reported in Blanpied et al., 1991, 1998
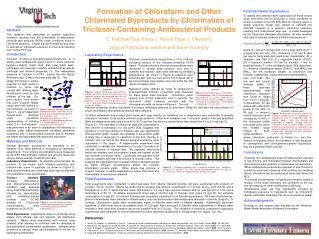
Blanpied et al., 1998 Effect of temperature and water
∂f /∂ln(V), “a value” Clayey fault gouge from Hanaore fault, Southwest Japan Figure from a presentation by Rice, 2007 Figure from Noda and Shimamoto [2009] a-value seems nearly proportional to the absolute temperature explained by a microscopic slip process which requires thermal activation [Nakatani 2001, Rice et al. 2001].
Friction law accounting for a slip process which requires thermal activation How aln(V) is understood. [Nakatani, 2001; Rice et al., 2001; Noda 2008] If the strength at microscopic asperities plays an important role, Possible slip patches in an asperity Success frequency for slipping Positive dir. Negative dir. E1 kB Tc W tc n0 : : : : : : Activation energy Boltzmann constant Contact temperature Activation volume Contact shear stress Attempt frequency ~ highest lattice vibration frequency
Contact shear stress Slip rate, V is given by Solving for the contact shear stress, V r l : : : Slip rate Area density of slipping sites Slip for a single success, ~ cell size If the negative jumps are negligible, Logarithmic direct effect proportional to Tc
Macroscopic shear stress Real contact area => or Nominal area Hardness by definition
∂fss /∂(1/T) Cold Hot Figure from Blanpied et al., 1995 The friction coefficient increases in a limited range of the temperature, from 25 oC to about 350 oC but depending on the slip rate.
∂f /∂(1/T) Temperature step tests by Chester [1994] Figure from Chester, 1994 On an abrupt (-/+) change in T, a (+/-) direct effect is observed followed by a (-/+) evolution effect.
A constitutive law assuming time-temperature superposition [Chester, 1994] Temperature accelerates processes A phenomenological law “Master curve” Q: activation energy, kB: Boltzmann constant is a line in Arrhenius plot. An assumption to explain the temperature-step tests Qa: Activation energy of a process governing the direct effect Qb: Activation energy of a process governing the evolution effect Z*: Temperature-reduced rate or Zener-Hollomon parameter kB: Boltzmann constant Chester [1994] proposed a slip-law formulation with constant a and b.
Development of microstructures Riedel shear Logan et al., 1992
Large (> hundreds) shear strain Beeler et al., 1996 al.
Early stage before localization Slip: 10 mm, a-b > 0
Locarization of strain rate on Y-plane Slip: 65 mm, a-b < 0
Widening of the foliated gouge layer Slip: 407 mm, a-b: positive to neutral
High velocity friction Plate motion ~ 1 cm/yr Earthquake “Byerlee’s law” [1978] Weakening Figure from Wibberley et al., 2008
High-velocity friction experiments Figure from Tsutsumi and Shimamoto, 1997 High velocity friction apparatus at Kochi Core Center
Typical mechanical behavior at low sn Weakening due to widening of molten (viscous) layer First weakening Strengthening due to melt-patch generation At high sn, second peak appears just after the beginning of experiment. Figures from Hirose and Shimamoto, 2005
Tsutsumi and Shimamoto, 1997 Tullis and Goldsby 2003 Gabbro Flash heating Rotary shear apparatus at Brown University, V < 0.36 m/s, sn = 5 MPa Figures from Tullis and Goldsby 2003 Frictional behavior at high slip rate is completely different!
Friction law at intermediate slip rate accounting for flash heating First introduced in a field of dry metal friction Bowden and Thomas, 1954; Archard, 1958/1959; Ettles, 1986; Lim and Ashby, 1987; Lim et al., 1989; Molinari et al., 1999 Temperature: T tc, Tc Defined by REV >> atom Very high stress (~yield stress) and high slip rate. Extremely high temperature at the contact (~ melting, decomposition, or oxidization point). Defined by REV >> asperities Abrupt weakening of asperities at a weakening temperature possibly because of phase transformation [Rice, 1999] The contact temperature must be important even below the “weakening temperature”. Aim: Derive a frictional constitutive law accounting for flash heating and the microscopic constitutive law explained so far.
High slip rate, Tc > about 1000 oC [Rice, 2006] Microscopic heat conduction. with In this timescale, slip rate is constant. q : age of an asperity Assumptions: - An asperity weakens when its temperature reaches Tw. - All asperities are either totally weakened of unweakened. - One-sized (D) asperities. where Rice 1999, 2006; Tullis and Goldsby 2003
Tullis and Goldsby 2003 Gabbro Experimental evidence Novaculite (mostly quartz) Figure from Tullis et al., 2006
High velocity experiments with gouge Sample: natural fault gouge from Nojima fault, Southwest Japan, a source fault of 1995 Kobe Earthqake Mizoguchi et al., 2009
Experimental texture at different slip Natural texture from Nojimafalt Mizoguchi et al., 2009
Thermal pressurization of pore fluid Sibson, 1973; Lachenbruch, 1980; Mase and Smith, 1985, 1987; Andrews, 2002; Rice, 2006 (Also suggested for mechanism of catastrophic landslides) Effective stress law pore pressure For Infinitesimally thin slipping zone Conservation of energy B.C. Conservation of fluid mass [Sibson, 1973; Lachenbruch, 1980; Mase and Smith, 1987; Andrews, 2002; Rice, 2006]
Extremely concentrated deformation Thin section of Punchbowl fault, South California Existence of principal slip plane ~100 - 300 mm Chester et al. 2005, 2003; Chester and Goldsby, 2003
Analytical solution With fixed slip rate and frictional coefficient, where , Normalized shear stress -Apparent evolution distance is a good fraction of total slip. (Multiple scale behavior) -Mathematically steady state shear stress is zero, regardless of slip rate. Rice, 2006
National Monument in Iidaka Town, Mie Prefecture Median Tectonic Line in Japan Hydraulic properties (1) Wide and complex fault zone (2) Very straight fault plane (3) Concentrated deformation zone (Ca. 50 mm wide) Tsukide Outcrop Wibberey and Shimamoto, 2003
Hydraulic property of fault rock Wibberley and Shimamoto, 2003
How long is L*? Intact MTL clayey gouge Accounting for “damage” with f = 0.25 and V = 1 m/s Rice, 2006
Predicted “seismic” fracture energy Definition Figure from Rice, 2006
3D calculation allowing changes in temperature and pore pressure Noda and Lapusta, 2010 Inertial effects are included. 30 MPa initial effective normal stress. Flash heating is not included. Two patches (15 km x 15 km) Patch I at negative x Rate-weakening friction High hydraulic diffusivity Patch II at positive x Rate-weakening friction Potentially low hydraulic diffusivity (susceptible to thermal pressurization)
A sequence of earthquakes
The resulting complexity in EQ magnitude distribution Magnitude of the events as a function of time Without heterogeneity, the model produces characteristic events. Heterogeneity causes long earthquake cycles that contain events of different sizes.
Heterogeneity in the hydraulic diffusivity Slip distribution at z = 0, black lines every 1 sec during EQs and gray ones every 10 years The region more susceptible to thermal pressurization has larger displacements in model-spanning events. The slip deficit in the other region is filled with smaller and more frequent events.
Stress-reduction curves and low heat generation Shear stress as a function of slip at x = 10 km Apparent stress weakening distance is determined by rate- and state-law in the permeable region, and by T.P. in the less permeable region.
Interseismic shear stress Shear stress at z = 0. In the region of efficient thermal pressurization, shear stress is lower interseismically due to larger stress drop. That is why events that occur early in the cycle may not propagate into that region.
Stress-reduction curves and low heat generation Shear stress as a function of slip at x = -10 km (black) and 10 km (gray). Apparent stress weakening distance is determined by rate- and state-law in the permeable region, and by T.P. in the less permeable region.