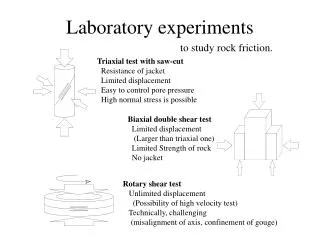
Laboratory Experiments
Formation of Chloroform and Other Chlorinated Byproducts by Chlorination of Triclosan-Containing Antibacterial Products E. Matthew Fiss, Krista L. Rule & Peter J. Vikesland Virginia Polytechnic Institute and State University. Potential Health Significance.

Laboratory Experiments
E N D
Presentation Transcript
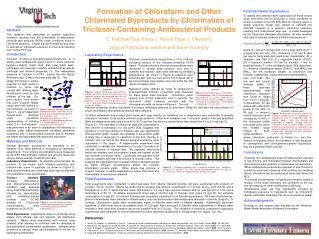
Formation of Chloroform and Other Chlorinated Byproducts by Chlorination of Triclosan-Containing Antibacterial Products E. Matthew Fiss, Krista L. Rule & Peter J. Vikesland Virginia Polytechnic Institute and State University Potential Health Significance To assess the potential health significance of these results since chloroform can be produced in some conditions at levels in excess of the US EPA MCL for drinking water, a simple exposure model was utilized to estimate the potential increase in a person’s chloroform exposure resulting from antibacterial soap use. A model developed by the Soap and Detergent Association (6) was modified and used to estimate a person’s inhalational exposure: Abstract This research was performed to quantify byproduct formation resulting from the chlorination of antibacterial personal care products (PCPs) under conditions found in real-world situations. Simple exposure modeling was used to estimate an individual’s exposure to chloroform resulting from normal PCP use. where A = amount of soap used (12.0 g body wash and 1.7 g liquid soap per use), FQ = frequency (1.07 and 8 uses per day for body wash and liquid soap, respectively), IR = inhalation rate (546 L/hr), F = respirable fraction (0.257), ED = exposure duration (10 min for showers, 1 min for washing hands), T = time correlation factor (365 days/year), V = effective breathing air space (2000 L), and MWCF and MWTric are the molecular weights of chloroform and triclosan, respectively. Using chloroform yields ranging Introduction Laboratory Experiments Triclosan (5-chloro-2-(2,4-dichlorophenoxy)phenol) is a widely used antibacterial agent found in many personal hygiene products (hand soap, dish soap, body wash, toothpaste, etc) because it exhibits antibacterial as well as antifungal and antiviral properties (1). The widespread presence of triclosan in PCPs means that the typical American uses ~5 mg of triclosan each day (2). This Triclosan concentrations ranged from 1.14 to 3.48 mg triclosan/g product in the triclosan-containing PCPs tested. Triclosan and free-chlorine concentrations were monitored in several soap solutions over time to examine how reaction rates were affected by elevated temperatures. As shown in Figure 3, reactions were extremely fast, and over half (and in 3 of 5 cases, all) of the total triclosan consumption occurred within the first minute of reaction time. Byproduct yields (defined as moles of compound X produced/moles triclosan consumed) were assessed for these same soap solutions. Chloroform yields ranged from 0-0.36 mole/mole and in general, the chloroform yields inversely correlate with the chlorophenol yields, as shown in Figure 4. The only from 0.07-0.29 (the low end and overall average yields of those observed experimentally), total chloroform exposure was found to range from 7.5-31.1 mg/year. Comparatively, for tap waters with chloroform levels at the MCL of 80 μg/L, a person’s overall exposure could increase by 15-40%, if the chloroform yields from soap use is within the tested range (Figure 6). Even under conditions usage introduces a unique potential for high levels of triclosan to come into contact with drinking water disinfectants, such as free chlorine, at the tap. Our prior studies have shown that pure triclosan readily reacts with free chlorine to form products, as shown in Figure 1, via pH dependent second-order reactions under conditions representative of drinking water (3,4). This research Figure 3:Triclosan concentration prior to chlorine addition and after 1 minute of reaction time. No additional triclosan was consumed after the first minute. Conditions: [HOCl]i = 2.0 mg/L as Cl2, [NaHCO3] = 2 mM, [Soap] = 0.25 g/L, pH = 7.0, T = 40 oC. Error bars reflect the standard deviation of triplicate samples. Figure 4:Experimental yields of chloroform, 2,4-dichlorophenol, and 2,4,6-trichlorophenol after exposure of a given soap to free chlorine for one minute. Conditions: [HOCl]i = 2.0 mg/L as Cl2, [NaHCO3] = 2 mM, [Soap] = 0.25 g/L, pH = 7.0, T = 40 oC. triclosan-containing solution that failed to produce detectable amounts of chloroform (Soap IV) was also the only solution for which intermediate chlorophenoxy-phenols were detected. To better understand how product yield varies with soap identity, an additional set of experiments was conducted to quantify chloroform formation for all sixteen unknown soap solutions. Chloroform formation over 1 minute of reaction time was quantified while the temperature was varied from 40 to 30 oC and the free chlorine concentration was varied from 4.0 to 2.0 mg/L as Cl2 Figure 1: Reaction pathway for triclosan decomposition when chlorinated. A) 5,6-dichloro-2-(2,4-dichlorophenoxy)phenol, B) 4,5-dichloro-2-(2,4-dichlorophenoxy)phenol, C) 4,5,6-trichloro-2-(2,4-dichlorophenoxy)phenol, D) 2,4-dichlorophenol, E) 2,4,6-trichlorophenol, F) chloroform Figure 6: Estimated consumer exposure to chloroform produced by the degradation of antibacterial soap as predicted using the modified model. Solid lines illustrate the percentage of exposure resulting from the antimicrobial soap use under average- and low- chloroform yield conditions, as compared to tap water with between 0 and 150 g/L chloroform. Dashed lines represent the total chloroform exposure of an individual. (Figure 5). The decrease in chloroform yield with a decrease in free chlorine concentration, for any given soap, suggests that variations in the free chlorine to triclosan ratio can significantly affect product yields. Overall, the variability in the product yields is likely due in large part to variations in the free chlorine to triclosan ratio, as well as the chlorine demand exerted by other ingredients in the soaps. A reagent-spike experiment was conducted to validate the dependence of product formation on the free chlorine to triclosan ratio. As expected, chloroform yields are smallest and chlorophenol yields are highest at low free chlorine to triclosan ratios. Conversely, the opposite is the case for samples with high free chlorine to triclosan ratios. This supports the hypothesis that increased chlorine demand exerted by higher triclosan concentrations affects the triclosan chlorination product yields. When ample free chlorine is present, triclosan is readily degraded to produce chloroform and intermediate concentrations diminish. was performed in an effort to characterize the reactivity of triclosan under higher temperature conditions simulating household use of antimicrobial products and to estimate the health risk associated with byproduct exposures. c) where chloroform production is limited (i.e. low free chlorine to triclosan ratios), the formation of and exposure to chlorophenol and chlorophenoxy-phenol byproducts may be a potential health concern. Materials and Methods General laboratory procedures, as described in the literature (3,4), were adhered to throughout all laboratory experiments. Free chlorine concentrations were measured by the DPD-FAS titrimetric method and pH was measured using a Fisher scientific model 60 pH meter. Laboratory Experiments. To eliminate potential bias, all products to be tested (both triclosan-containing and triclosan-free, some in duplicate, as shown in Figure 2) were double-blinded and code-keys were kept confidential until completion of all experiments. Conclusions • Triclosan from antibacterial soap is oxidized when exposed to free chlorine, and chlorinated triclosan intermediates and chlorophenols were detected in measurable concentrations. • When antibacterial products are exposed to free chlorine in conditions commonly observed when bathing and washing dishes, chloroform can be produced at levels well above the MCL. • The actual concentrations of byproducts formed is largely a function of the water chemistry, the conditions at the tap, and the reactivity of other constituents in the soap. • Antibacterial soap use may significantly increase an individual’s exposure to byproducts such as chloroform, thereby potentially increasing the risk to the person’s health. Figure 5: Chloroform produced after 1 minute of reaction time. Conditions: [NaHCO3] = 2 mM, pH = 7.0. Free chlorine concentrations are given in mg/L as Cl2. Error bars reflect the standard deviation of triplicate samples. Product Analysis. Triclosan, chlorophenol, and chlorophenoxy-phenol formation was analyzed using solid-phase extraction followed by derivatization with pentafluorobenzyl bromide and GC-MS analysis (3). Chloroform concentrations were quantified via GC-ECD. Field Experiments Field experiments were conducted in which tap water from Atlanta, GA and Danville, VA were augmented with products VI (control), VII, IX, and XII. Atlanta tap water had an average free chlorine concentration of 1.0 mg/L as Cl2, a pH of 6.35, and a temperature of 33 oC while Danville water maintained a 1.6 mg/L free chlorine residual with an average pH of 7.22 and a temperature of 38 oC. In Atlanta experiments, there was a minimal loss of triclosan from soaps IX and XII, but complete consumption for soap VII. In contrast, triclosan was completely consumed for all Danville experiments. All three chlorophenoxy-phenol intermediates were detected in Atlanta water, only one dichlorinated intermediate was detected in Danville (Soap IX). In contrast, chlorophenol yields were considerably higher in Danville water than in Atlanta samples. Additionally, significant quantities of chloroform above the baseline level of 72.5 μg/L were produced in Danville while experiments in Atlanta water resulted in little chloroform formation above the baseline level of 37.6 μg/L. The variations in results as compared to laboratory experiments were attributed to chlorine demand from other dissolved constituents in the tap water (i.e. copper, iron, etc.). Acknowledgments Figure 2: A variety of common triclosan-containing and triclosan-free personal care products were purchased for experimental use. Funding for this reseach was provided by the American Water Works Association Research Foundation. Field Experiments. Experiments were run at the tap using waters from Atlanta, GA and Danville, VA distribution systems. Waters were augmented with various soap products after allowing for sufficient time for temperature and disinfectant concentration equilibration. Samples were quenched at various times and transported to the lab for byproduct quantification. References 1. Jones, R; Jampani, H; Newman, J; Lee, A. Triclosan: A review in effectiveness and safety in health care settings. Am. Jour. Infect. Control2000, 28, 184-196. 2. McAvoy, D; Schatowitz, B; Jacob, M; Hauk, A; Eckhoff, W. Measurement of triclosan in wastewater treatment systems. Envir. Tox. Chem.2002, 21, 1323-1329. 3. Rule, K; Ebbett, V; Vikesland, P. Formation of chloroform and chlorinated organics by free-chlorine-mediated oxidation of triclosan. ES&T,2005, 39, 3176-3185. 4. Vikesland, P., et al. Triclosan Reactivity in Chlorinated and Chloraminated Waters. 2006, Denver, CO: American Water Works Association Research Foundation. 5. Soap and Detergent Association. Exposure and risk screening methods for consumer product ingredients.2005.