Download
1 / 53
530 likes | 550 Vues
Explore the use of ensemble-based background error covariances within variational data assimilation for Numerical Weather Prediction (NWP) systems. Collaborative analysis of operational NWP configurations and experimental setups with spatial covariance localization for enhanced forecast accuracy.

E N D
Use of ensemble background-error covariances within variational data assimilation for NWP Collaborators: Peter Houtekamer Herschel Mitchell Cecilien Charette Bin He Gerald Desroziers Loik Berre Ron McTaggart-Cowan Mark Buehner Meteorological Research Division August 1-11, 2011 LMS - EPSRC Durham Symposium on the Mathematics of Data Assimilation
Contents • Brief description of Canadian operational NWP systems • Description of experimental configurations • Spatial covariance localization • Full analysis-forecast NWP experiments with different approaches for B matrix: • 3D ensemble covariances with spatial localization • 4D ensemble covariances with spatial localization • weighted average of stationary covariances and 3D ensemble covariances with spatial localization • Approach and results from using 3D ensemble covariances with spatial and spectral localization • Conclusions and next steps
Introduction • Goal: examine various approaches for using flow-dependent ensemble-based background error covariances within global deterministic analysis system for operational NWP • Initial project initiated in anticipation of WMO workshop on intercomparison of 4D-Var and EnKF, Buenos Aires, November 2008 • 4D-Var and EnKF: • both operational at CMC since 2005 • both use GEM forecast model • both assimilate similar set of observations using mostly the same observation operators and observation error covariances • current effort towards unifying code of the two systems • 4D-Var is used to initialize medium range global deterministic forecasts • EnKF is used to initialize global Ensemble Prediction System
Operational Systems (up to June 2009) • 4D-Var (Gauthier et al. 2007) • incremental approach: ~35km/150km grid spacing, 58 levels, 10hPa top (now 80 levels, 0.1hPa top) • EnKF (Houtekamer and Mitchell 2005, Houtekamer et al. 2005) • 96 ensemble members (soon 192): ~100km grid spacing, 28 levels, 10hPa top (now 58 levels) • uses 4D background-error covariances to produce 4D analysis (somewhat like 4D-Var, but without TL/AD of forecast model) • assimilates batches of observations sequentially by expliciting solving analysis equation and updating ensemble covariances • additive model error, no covariance inflation
Experimental ConfigurationsModifications relative to 2009 operational systems • Exactly same observations, including conventional data and satellite radiances, assimilated in all experiments • Increased number of levels in EnKF to match 4D-Var • Increased horizontal resolution of 4D-Var inner loop to match EnKF • Other minor modifications in both systems to obtain nearly identical innovations (each tested to ensure no degradation)
Experimental Configurations • Variational data assimilation system (Buehner et al. 2010): • 3D-Var and 4D-Var with stationary B matrix as in operational system: NMC method (Bnmc) • 3D-Var and 4D-Var with flow-dependent B matrix from EnKF with same localization parameters as in EnKF (Benkf) • Ensemble-Var (En-Var): use 4D ensemble covariances to produce 4D analysis without TL/AD models (most similar to EnKF approach) • 3D-Var with B matrix computed as weighted average between Bnmc and Benkf(Bavg) (idea from Hamill and Snyder 2000) • 3D-Var with B matrix from EnKF, but with spatial and spectral localization (Buehner 2011, submitted) • EnKF: Deterministic forecasts initialized with EnKF ensemble mean analysis (requires interpolation from ~100km to ~35km grid)
Experimental Configurations • Variational data assimilation system (Buehner et al. 2010): • 3D-Var and 4D-Var with stationary B matrix as in operational system: NMC method (Bnmc) • 3D-Var and 4D-Var with flow-dependent B matrix from EnKF with same localization parameters as in EnKF (Benkf) • Ensemble-Var (En-Var): use 4D ensemble covariances to produce 4D analysis without TL/AD models (most similar to EnKF approach) • 3D-Var with B matrix computed as weighted average between Bnmc and Benkf(Bavg) (idea from Hamill and Snyder 2000) • 3D-Var with B matrix from EnKF, but with spatial and spectral localization (Buehner 2011, submitted) • EnKF: Deterministic forecasts initialized with EnKF ensemble mean analysis (requires interpolation from ~100km to ~35km grid) Interesting alternative to 4D-Var: doesn’t require development work related to TL/AD of forecast model, lower computational cost if ensemble members already available
Spatial covariance localization(Hamill et al. 2001) • At large separation distances covariances should be small, but estimation error dominates sample covariance estimate • Necessary to reduce distant covariances to reasonably fit large number of observations with only ~100 ensemble members • Severe localization can cause imbalance – more localization required for small ensemble size • Smoothly taper 3D spatial correlations to zero at large separation distance using a Schur product with a positive semi-definite “localization” matrix: B = L◦Bsample • Elements of L typically computed with a function resembling a Gaussian, but reaches zero at finite distance (e.g. 2800km) • For En-Var each 3D block of 4D B matrix is localized in the same way
Spatial localization in variational system(Buehner 2005, Lorenc 2003) • In variational assimilation pre-conditioned with respect to background term, control vector is related to analysis increment by: ∆x = B1/2 ξ • Approach for using ensemble-based B: • no localization: elements of control vector determine global contribution of each normalized ensemble member deviation to the analysis increment: ∆x = ∑kekξk (ξk is a scalar) • spatial localization: elements of control vector determine local contribution of each ensemble member to the analysis increment: ∆x = ∑keko (L1/2ξk) (ξk is a 3D vector, ek is 3D or 4D) • can also combine with standard BNMC matrix (βBens+(1-β)BNMC): ∆x = β1/2 ∑keko (L1/2ξk) + (1-β)1/2 BNMC1/2ξHI • in each case, background cost function Jb is Euclidean inner product: Jb = 1/2 ξT ξ(augmented control vector in case of averaged covariances)
Analysis and Forecast Verification Results En-Var vs. standard approaches and En-Var vs. use of 3D ensemble B matrix En-Varvs. EnKF and En-Var vs. 4D-Var-Bnmc and En-Varvs. 3D-Var-Benkf and En-Varvs. 4D-Var-Benkf
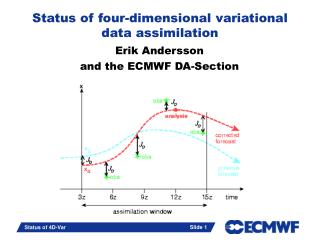
4D error covariancesTemporal covariance evolution (explicit vs. implicit evolution) EnKF and En-Var: 96 NLM integrations 3D-Var-Benkf only uses these members 4D-Var: 55 TL/AD integrations, 2 outer loop iterations, then 3h NLM forecast -3h 0h +3h “analysis time”
Single observation experimentsDifference in temporal covariance evolution En-Var • radiosonde temperature observation at 500hPa • observation at beginning of assimilation window (-3h) • with same B, increments very similar from 4D-Var, EnKF • contours are 500hPa GZ background state at 0h (ci=10m) + + contour plots at 500 hPa + +
Single observation experimentsDifference in temporal covariance evolution En-Var • radiosonde temperature observation at 500hPa • observation at middle of assimilation window (+0h) • with same B, increments very similar from 4D-Var, EnKF • contours are 500hPa GZ background state at 0h (ci=10m) + + contour plots at 500 hPa + +
Single observation experimentsDifference in temporal covariance evolution En-Var • radiosonde temperature observation at 500hPa • observation at end of assimilation window (+3h) • with same B, increments very similar from 4D-Var, EnKF • contours are 500hPa GZ background state at 0h (ci=10m) + + contour plots at 500 hPa + +
Forecast Results:En-Var vs. EnKF north tropics south Difference in stddev relative to radiosondes: Positive En-Var better Negative EnKF better En-Var uses incremental approach, deterministic analysis EnKF uses ens. mean at lower resolution zonal wind temp. height
Forecast Results:En-Var vs. 4D-Var-Bnmc north tropics south Difference in stddev relative to radiosondes: Positive En-Var better Negative 4D-Var-Bnmc better zonal wind temp. height
Forecast Results:En-Var vs. 3D-FGAT-Benkf north tropics south Difference in stddev relative to radiosondes: Positive En-Var better Negative 3D-FGAT-Benkf better zonal wind temp. height
Forecast Results:En-Var vs. 4D-Var-Benkf north tropics south Difference in stddev relative to radiosondes: Positive En-Var better Negative 4D-Var-Benkf better zonal wind temp. height
Results – 500hPa GZ anomaly correlation Verifying analyses from 4D-Var with Bnmc Northern hemisphere Southern hemisphere 3D-FGAT Benkf En-Var 4D-Var Benkf 3D-FGAT Benkf En-Var 4D-Var Benkf
Results – 850hPa Temperature bias Verifying analyses from mean of 3 reanalyses (ECMWF, NCEP/NCAR, JMA) 4D-Var-Bnmc 0UTC, 12UTC 6UTC, 18UTC
Results – 850hPa Temperature bias Verifying analyses from mean of 3 reanalyses (ECMWF, NCEP/NCAR, JMA) 4D-Var-Benkf 0UTC, 12UTC 6UTC, 18UTC
Results – 850hPa Temperature bias Verifying analyses from mean of 3 reanalyses (ECMWF, NCEP/NCAR, JMA) En-Var 0UTC, 12UTC 6UTC, 18UTC
Results – Temperature error over N. Africa Verifying analyses from mean of 3 reanalyses (ECMWF, NCEP/NCAR, JMA) Bias StdDev large sensitivity to B at 850hPa over certain areas in the tropics, why? possible problem over land affecting all experiments
Results – Temperature error over N. midlat Verifying analyses from mean of 3 reanalyses (ECMWF, NCEP/NCAR, JMA) Improvement in background state less clear over the northern extra-tropics Bias StdDev
Analysis and Forecast Verification Results Averaged covariances vs. Bnmc and Benkf(similar approach already operational at Met Office) Bavg = ½ Bnmc + ½ Benkf 3D-Var-Bavg vs. 3D-Var-Bnmc and 3D-Var-Bavg vs. 3D-Var-Benkf
Forecast Results:3D-Var-Bavg vs. 3D-Var-Bnmc north tropics south Difference in stddev relative to radiosondes: Positive 3D-Var-Bavg better Negative 3D-Var-Bnmc better zonal wind temp. height
Forecast Results:3D-Var-Bavg vs. 3D-Var-Benkf north tropics south Difference in stddev relative to radiosondes: Positive 3D-Var-Bavg better Negative 3D-Var-Benkf better zonal wind temp. height
Results – 500hPa GZ anomaly correlation Verifying analyses from 4D-Var with Bnmc Northern hemisphere Southern hemisphere Benkf0.50and0.75 are best Benkf0.75and 1.00 are best Bnmc and Benkf 1.00 worst Bnmc worst Bnmc Benkf 0.25 Benkf 0.50 Benkf 0.75 Benkf 1.00
Comparison of several approaches for using ensemble correlations (Buehner 2011, submitted) • During visit to Meteo-France, compared several approaches for using ensemble-based covariances in a variational assimilation system: • spatial localization (standard Schur product approach): B = L◦Bsample • wavelet diagonal (as developed and used at ECMWF): B = W-1diag(WBsampleWT) W-T • spectral diagonal (homogeneous/isotropic correlations): B = S-1diag(SBsampleST) S-T also variances averaged for each n • new spatial/spectral localization approach that combines aspects of spatial localization and wavelet diagonal approaches: B = ΣjLj◦(WjBsampleWjT) spatial localization and diagonal wrt scale j ***new approach allows scale-dependent spatial localization***
Spatial/Spectral correlation localization • In variational assimilation pre-conditioned with respect to background term, control vector is related to analysis increment by: ∆x = B1/2 ξ • Approach for using ensemble-based B: • spatial localization: elements of control vector determine local contribution of each ensemble member to the analysis increment: ∆x = ∑keko (L1/2ξk) (ξk is a 3D vector) • spatial/spectral localization: elements of control vector determine local contribution of each ensemble member for a particular horizontal scale: ∆x = ∑j∑kek,jo (Lj1/2ξk,j) where ek,j = Wjek = S-1ΨjS ek • could also be used in EnKF
Spatial/Spectral correlation localization • In variational assimilation pre-conditioned with respect to background term, control vector is related to analysis increment by: ∆x = B1/2 ξ • Approach for using ensemble-based B: • spatial localization: elements of control vector determine local contribution of each ensemble member to the analysis increment: ∆x = ∑keko (L1/2ξk) (ξk is a 3D vector) • spatial/spectral localization: elements of control vector determine local contribution of each ensemble member for a particular horizontal scale: ∆x = ∑j∑kek,jo (Lj1/2ξk,j) where ek,j = Wjek = S-1ΨjS ek • could also be used in EnKF 3D field for each scale and each member wavelet functions: overlapping band-pass spectral filter
Spatial/Spectral correlation localizationEffective wavenumber localization matrix wavelet functions used for wavelet diagonal approach • making correlations diagonal with respect to wavelet bands causes spectral localization • spectral localization is equivalent to local spatial averaging of correlation functions more severe localization causes spatial averaging over a larger area • extent of spectral localization governed by choice of wavelet functions wavelet functions used for new spatial/spectral localization approach
Spatial/Spectral correlation localizationMeasuring correlation estimation error for each spectral band n=032 n=165 • mean correlation and estimation error as function of separation distance for different spectral bands • compute covariance between 2 independent samples: “agreement” • for higher wavenumber bands: • average correlation sharper (no surprise) • large estimation error begins at shorter separation distance • therefore could benefit from more severe spatial localization: scale-dependent spatial localization n=3498 n=6799 note: estimation error is large when agreement < magnitude n=099
Spatial/Spectral correlation localization • idealized experiments with “true” correlations produced from 96-member EnKF ensemble of 500hPa temperature with weak spatial localization • 48-member random ensemble generated using “true” correlations and each approach applied • with new approach, less spatial localization applied to large scales than small scales: scale-dependent localization
Spatial/Spectral correlation localization • zonal correlation length scale computed using Daley’s definition: (-d2c/dx2)-1/2 • finite difference approximation for second derivative centered on origin of each correlation function
Spatial/Spectral correlation localization • rms error of each correlation estimate averaged over all separation distances (up to 3000km) and over many locations over North America
Spatial/Spectral correlation localization raw sample raw sample and truth • mean correlation and error stddev of correlations as a function of separation distance • spatial/spectral localization and wavelet diagonal approaches do not reproduce variance of 1 everywhere (possibly due to uneven spectral localization)
Spatial/Spectral correlation localization Impact of using scale-dependent localization • mean correlation and error stddev of correlations as a function of separation distance • solid = scale-dependent localization (3500km, 3000km, 2500km, 2000km) • dashed = scale-independent localization (3000km) similar error stddev with scale-dependence smaller negative bias with scale-dependence truth
Spatial/Spectral correlation localization • single observation of 500hPa temperature near region of strong north-westerly winds • temperature increment = shading • wind increment = vectors • background 500hPa geopotential height = contours
Spatial/Spectral correlation localization • single observation of 500hPa temperature near region of strong north-westerly winds • temperature increment = shading • wind increment = vectors • background 500hPa geopotential height = contours
Spatial/Spectral correlation localization 1-month 3D-Var data assimilation experiments • initial value of radiosonde cost function shows that spatial/spectral localization produces better analyses than with spatial localization only • scale-dependent spatial localization better than using same spatial localization for all scales Initial value of Jraob
Spatial/Spectral correlation localization 1-month 3D-Var data assimilation experiments • 48h forecasts from using a B matrix estimated from: • grey: 96 ensemble members with spatial localization only • black: 48 ensemble members with spatial localization only
Spatial/Spectral correlation localization 1-month 3D-Var data assimilation experiments • 48h forecasts from using a B matrix estimated from: • grey: 96 ensemble members with spatial localization only • black: 48 ensemble members with spatial localization and spectral localization over 6 evenly spaced total wavenumber bands
Spatial/Spectral correlation localization 1-month 3D-Var data assimilation experiments • 48h forecasts from using a B matrix estimated from: • grey: 96 ensemble members with spatial localization only • black: 48 ensemble members with spatial localization and spectral localization over 6 evenly spaced total wavenumber bands, scale-dependent spatial localization
Conclusions • En-Var approach is attractive possible alternative to 4D-Var and current EnKF sequential* analysis approach (*wrt batches of observations) • advantages of En-Var vs. full 4D-Var: • no need to maintain TL/AD version of model dynamics and physical parameterizations (EnKF members already available) • more computationally efficient and likely easier to parallelize for high spatial resolution and large data volumes • potential advantages from using En-Var within EnKF instead of current approach: • global analysis (all obs treated together – don’t have to perform all analyses in parallel) • localization of B instead of BHT (latter is a potential problem for non-local observations: satellite radiances) • allows use of alternative approaches for modelling covariances: e.g. averaged covariances • allows use of variational quality control
Next Steps • Test En-Var approach in operational configuration of deterministic prediction system to compare with 4D-Var (requires raising top level of EnKF to 0.1hPa and synchronization in development of the two systems) • Examine possibility of using a variational approach for EnKF analysis step (i.e. can En-Var be made efficient enough to perform 192 analyses in < 1 hour? Or can we use less members with En-Var than EnKF? Can the minimizations work together?--Gerald’s talk) • Continue to modularize/unify the code for Variational and EnKF data assimilation systems to facilitate further development of both systems and hybrid approaches as described above
References Buehner, M., 2005, "Ensemble-derived stationary and flow-dependent background error covariances: Evaluation in a quasi-operational setting for NWP ." Quart. J. Roy. Meteor. Soc. Vol. 131, p1013-1044. Buehner, M., P.L. Houtekamer, C. Charette, H.L. Mitchell, B. He, 2010, "Intercomparison of variational data assimilation and the Ensemble Kalman Filter for global deterministic NWP. Part I: Description and Single-Observation experiments." Monthly Weather Review. Vol. 138, p1550-1566. Buehner, M., P.L. Houtekamer, C. Charette, H.L. Mitchell, B. He, 2010, "Intercomparison of variational data assimilation and the Ensemble Kalman Filter for global deterministic NWP. Part II: One-Month Experiments with Real Observations." Monthly Weather Review. Vol. 138, p1567-1586. Gauthier, P., M. Tanguay, S. Laroche, S. Pellerin, J. Morneau, 2007, “Extension of 3DVAR to 4DVAR: Implementation of 4DVAR at the Meteorological Service of Canada.” Mon. Wea. Rev., Vol 135, p2339–2354. Hamill, T. M. and Snyder, C. 2000 A hybrid ensemble Kalman filter—3D variational analysis scheme. Mon. Weather Rev., Vol. 128, p2905–2919. Hamill, T. M., Whitaker, J. S. and Snyder, C. 2001 Distance-dependent filtering of background error covariance estimates in an ensemble Kalman filter. Mon. Weather Rev., Vol. 129, p2776–2790 Houtekamer, P. L., H. L. Mitchell, G. Pellerin, M. Buehner, M. Charron, L. Spacek and B. Hansen, 2005, "Atmospheric data assimilation with the ensemble Kalman filter: Results with real observations ." Monthly Weather Review, Vol. 133, p604-620. Houtekamer, P. L., and H. L. Mitchell, 2005, “Ensemble Kalman filtering.” Quarterly Journal of the Royal Meteorological Society, Vol 131, p3269–3289 Houtekamer, P. L., H. L. Mitchell, X. Deng, 2009, “Model Error Representation in an Operational Ensemble Kalman Filter.” Monthly Weather Review. Vol 137, p2126-2143. Lorenc, A. C. 2003 The potential of the ensemble Kalman filter for NWP: A comparison with 4D-Var. Q. J. R. Meteorol. Soc., Vol. 129, p3183–3203.
Forecast Results:En-Var vs. EnKF north tropics south Significance level of difference in stddev relative to radiosondes: Positive En-Var better Negative EnKF better zonal wind temp. Computed using bootstrap resampling of the individual scores for 48-hour non-overlapping periods. height Shading for 90% and 95% confidence levels
Forecast Results:En-Var vs. 4D-Var-Bnmc north tropics south Significance level of difference in stddev relative to radiosondes: Positive En-Var better Negative 4D-Var-Bnmc better zonal wind temp. Computed using bootstrap resampling of the individual scores for 48-hour non-overlapping periods. height Shading for 90% and 95% confidence levels