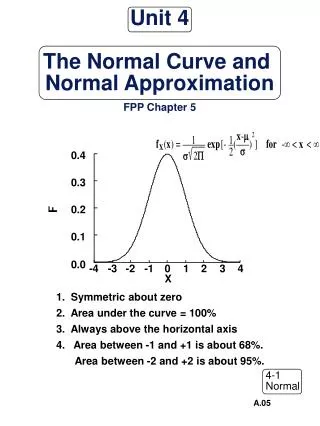
The Normal Approximation
The Normal Approximation. Unit 5, Day 4. Learning Goals for Today. I can identify the relationship between the Binomial Distribution and the Normal Distribution. I can state and find the mean and standard deviations used to approximate binomial distributions .

The Normal Approximation
E N D
Presentation Transcript
The Normal Approximation Unit 5, Day 4
Learning Goals for Today • I can identify the relationship between the Binomial Distribution and the Normal Distribution. • I can state and find the mean and standard deviations used to approximate binomial distributions. • I can solve problems using Normal Approximation using various aids(examples, notes, etc.).
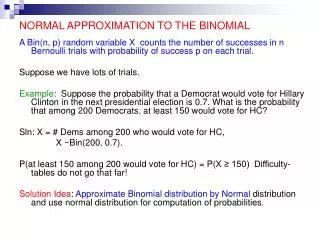
Binomial Distribution Recap We have seen that probabilities can be calculated using the formula for a binomial distribution provided that: • Each trial in the experiment is identical. • The outcomes of each trial can be classified as success or failure
Investigation A regular die is rolled 100 times and the number of 5’s that appear is recorded. Determine the probability that at most twenty 5’s are rolled.
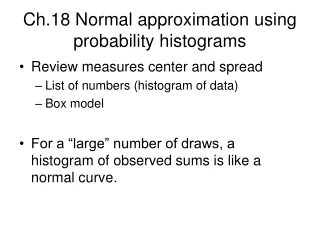
An observation… Above are two graphs that show the probability distributions for the number of 5’s rolled based on 5 and 50 trials. What do you notice?
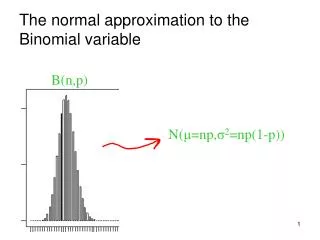
Even more trials… Key Point: As the number of trials increase, the Binomial Distribution can be modeled using the Normal Distribution!!!!!
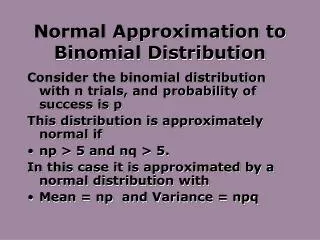
The Normal Approximation If X has a binomial distribution with n trials and probability of success p, then it can be approximated by a normal distribution with and provided that np>= 5 and nq>=5 This means that we can take those huge binomial distribution questions, convert over to a Normal Distribution, and use z-scores to solve it!
The Continuity Correction One issue is the fact that a Binomial Distribution is discrete (contains only countable outcomes) and a Normal Distribution is continuous. To account for this, we use a continuity correction (a value of +/- 0.5): For example: is corrected to is corrected to
Back to the Investigation A regular die is rolled 100 times and the number of 5’s that appear is recorded. Determine the probability that at most twenty 5’s are rolled.
Example #2 – Coin tossing A coin is tossed 60 times. • Find the probability that you toss tails exactly 25 times. • Estimate the probability you get tails 25 or more times.
Homework Page 311 #3, 4, 5, 6, 7, 8