7.7 Normal Approximation to the Binomial Distribution
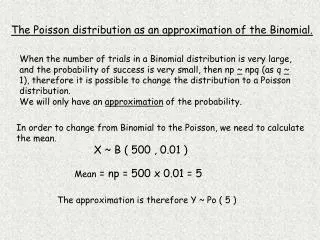
In a binomial setting with a large number of trials, the distribution of successes can be approximated using the normal curve. For instance, if a manufacturer has 300 faucet washers, with a defect rate of 2%, we calculate the probability of finding more than 10 defective washers. By using the normal approximation with parameters calculated from the binomial distribution, such as ( np ) and ( sigma^2 = npq ), we determine that approximately 3.22% of boxes will have more than 10 defective washers. This method simplifies calculations for binomial probabilities.


7.7 Normal Approximation to the Binomial Distribution
E N D
Presentation Transcript
7.7 Normal Approximation to the Binomial Distribution • Normal Approximation
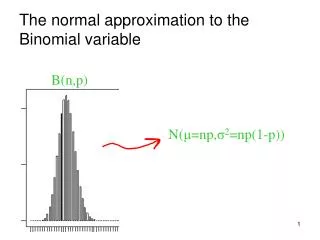
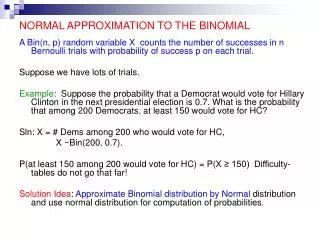
Normal Approximation Suppose we perform a sequence of n binomial trials with probability of success p and probability of failure q = 1 - p and observe the number of successes. Then the histogram for the resulting probability distribution may be approximated by the normal curve with = np and
Normal Approximation • Binomial distribution with n = 40 and p = .3
Example Normal Approximation A plumbing-supplies manufacturer produces faucet washers that are packaged in boxes of 300. Quality control studies have shown that 2% of the washers are defective. What is the probability that more than 10 of the washers in a single box are defective?
Example Normal Approximation (2) Let X = the number of defective washers in a box. X is a binomial random variable with n = 300 and p = .02. We will use the approximating normal curve with = 300(.02) = 6 and Since the right boundary of the X = 10 rectangle is 10.5, we are looking for Pr(X> 10.5).
Example Normal Approximation (3) The area of the region to the right of 1.85 is 1 - A(1.85) = 1 - .9678 = .0322. Therefore, 3.22% of the boxes should contain more than 10 defective washers.
Summary Section 7.7 • Probabilities associated with a binomial random variable with parameters n and p can be approximated with a normal curve having = np and