Data Presentation
Data Presentation. Geoff Dates River Network. Helping People Understand, Protect and Restore Rivers and Watersheds. Turning Data Into Information. Milestones 1) Program and Study Design 2) Monitoring and Recording 3) Data Entry and Validation 4) Data Summary 5) Data Interpretation


Data Presentation
E N D
Presentation Transcript
Data Presentation Geoff Dates River Network Helping People Understand, Protect and Restore Rivers and Watersheds
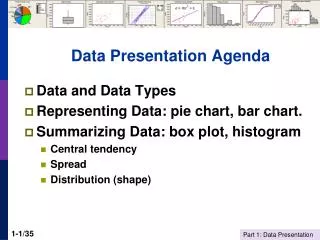
Turning Data Into Information Milestones 1) Program and Study Design 2) Monitoring and Recording 3) Data Entry and Validation 4) Data Summary 5) Data Interpretation 6) Data Presentation 7) Action and/or Further Monitoring
What People Remember 9% 32% 59% Oral Visual Alone Visual & Oral
Design Basics • Slide Layout • Type Size and Style • Color • Images
6 T he “Tree” starts to look like this: Watershed vision -Management goal 1 of N - Monitoring objective A B C List of 1 4 3 1 2 1 3 2 decision 2 a a b makers a b a Decisions b to be made d c 2 1 3 5 4 Information needs Slide Layout Avoid Clutter
A B C 6 Information Needs Decision Tree Management goal 1 of N Monitoring objectives 1 Decision Makers 3 2 Decisions they Make a c Slide Layout Avoid Clutter b Information needs 3 1 2
Design Basics Type Typeface:a collection of characters, letters and symbols that have a unique design: e.g. Arial. Font:a specific typeface in a specific point size and style. e.g. Arial 24 pt. Used interchangeably
Size Matters • Raise your hand if you can read this. (8 pt) • Raise your hand if you can read this. (10 pt) • Raise your hand if you can read this. (12 pt) • Raise your hand if you can read this. (16 pt) • Raise your hand if you can read this. (20 pt) • Raise your hand if you can read this. (24 pt) • Raise your hand if you can read this. (28 pt)
Fonts Matter • Which is easiest to read? Sans Serif “Other” Curlz MT Edwardian Script Lucida Handwriting Sand Textile Arial Comic Sans Helvetica Trebuchet Verdana Serif Courier Book Antigua Garamond Goudy Times New Roman
Design BasicsColor • Contrast • Warmth • Readability
Design BasicsColor Contrast and Readability Which Is Most Readable? Which Is Most Readable? Which Is Most Readable? Which Is Most Readable? Which Is Most Readable? Which Is Most Readable? Which Is Most Readable? Which Is Most Readable? Which Is Most Readable?
Design BasicsColor Contrast and Readability Which Is Most Readable? Which Is Most Readable? Which Is Most Readable? Which Is Most Readable? Which Is Most Readable? Which Is Most Readable? Which Is Most Readable? Which Is Most Readable? Which Is Most Readable?
Design BasicsColor Contrast and Readability Which Is Most Readable? Which Is Most Readable? Which Is Most Readable? Which Is Most Readable? Which Is Most Readable? Which Is Most Readable? Which Is Most Readable? Which Is Most Readable? Which Is Most Readable?
Design BasicsColor Contrast and Readability Which Is Most Readable? Which Is Most Readable? Which Is Most Readable? Which Is Most Readable? Which Is Most Readable? Which Is Most Readable? Which Is Most Readable? Which Is Most Readable? Which Is Most Readable?
Design BasicsColor Contrast and Readability Which Is Most Readable? Which Is Most Readable? Which Is Most Readable? Which Is Most Readable? Which Is Most Readable? Which Is Most Readable? Which Is Most Readable? Which Is Most Readable? Which Is Most Readable?
Design BasicsColor Contrast and Readability Which Is Most Readable? Which Is Most Readable? Which Is Most Readable? Which Is Most Readable? Which Is Most Readable? Which Is Most Readable? Which Is Most Readable? Which Is Most Readable? Which Is Most Readable?
Design BasicsColor Contrast and Readability Which Is Most Readable? Which Is Most Readable? Which Is Most Readable? Which Is Most Readable? Which Is Most Readable? Which Is Most Readable? Which Is Most Readable? Which Is Most Readable? Which Is Most Readable?
Design BasicsColor Contrast and Readability Which Is Most Readable? Which Is Most Readable? Which Is Most Readable? Which Is Most Readable? Which Is Most Readable? Which Is Most Readable? Which Is Most Readable? Which Is Most Readable? Which Is Most Readable?
Data Presentation • Summarize your data to tell your story • Tailor to your audience • Tailor to your audience • Time • Level of detail • Visuals • “Sound bites”
Data Presentation • Present your story • Reports • Posters • Slide Presentations • Video • Web site
E. Coli Bacteria (colonies per 100 ml) 1992 27-May 16-Jun 3-Aug 20-Aug 23-Sep 7-Oct 21-Oct Geomean MoB017 - - - - 500 324 300 365 MoB016 200 24000 10000 2500 700 200 500 1355 MoB015 7 430 10000 6200 1200 600 1400 788 MoB014 200 7500 - 13800 10000 2900 700 2737 MoB013 200 2400 - 12200 10000 1800 1300 2271 MoB001 200 90 770 310 7100 248 8 250 Data Presentation What Makes A Good Table? • Readable, logical data placement • Clear column and row headings • A title at the top • Reporting units
Data Presentation What Makes A Good Graph? • Clear title • Simple clear axis labels • Elements that allow the reader to get the point • A legend explaining graph elements • A scale appropriate to the data • Clear reporting units • Reveals a story • Minimum of clutter
Bacteria Bacteria 350 350 300 300 250 250 200 200 Colonies per 100 mL Colonies per 100 mL 150 150 100 100 50 50 0 0 6 5 4 3 2 1 6 5 4 3 2 1 Sites Sites Data Presentation What Makes A Good Graph?
E. coli Bacteria: E. coli Bacteria: 10/21/92 10/21/92 20000 2000 16000 1600 12000 Colonies per 100 mL 1200 Colonies per 100 mL 8000 800 4000 400 Water Quality Standard 0 0 Site Site Site Site Site Site Site Site Site Site Site Site 6 5 4 3 2 1 6 5 4 3 2 1 Data Presentation What Makes A Good Graph? The Importance of Scale
E. coli Results for 6/16/92 100000 10000 1000 Colonies per 100 mL 100 10 1 Site 6 Site 5 Site 4 Site 3 Site 2 Site 1 Sample Sites Data Presentation What Makes A Good Graph? The Importance of Scale WQ Standard
E. coli Results: 1992 30000 25000 5/27/92 6/16/92 20000 8/3/92 Colonies per 100 mL 15000 8/20/92 9/23/92 10000 10/7/92 10/21/92 5000 0 Site 6 Site 5 Site 4 Site 3 Site 2 Site 1 Sample Sites Data Presentation What Makes A Good Graph?
Geometric Mean of E. coli Results: 1992 3500 3000 2500 2000 Colonies per 100 mL 1500 1000 500 0 Site 6 Site 5 Site 4 Site 3 Site 2 Site 1 Data Presentation What Makes A Good Graph?
My Credibility Credibility Distance from Home
The Power of Images Watershed Management Goals
The Power of Images Watershed Management Goals
Stoneflies Dragonflies, Damselflies Mayflies Caddisflies Beetles Midges 1 inch A Tier 1 Community
Scuds Snails Leeches Caddisflies Midges Beetles Craneflies 1 inch A Tier 5-6 Community
Data Presentation >79% Not Impaired 29-72% Moderately Impaired <21% Severely Impaired