Improving Access Efficiency for Spatial Databases
This research focuses on improving the efficiency of spatial databases, particularly in browsing large datasets. Utilizing a combination of advanced histogram-based approaches, the project aims to enable rapid selectivity estimation for various spatial queries, such as intersection and containment. The study utilizes data from the Alexandria Digital Library and incorporates innovative methodologies to provide accurate query results while optimizing performance. Collaborators include experts from the University of California, Santa Barbara, working towards making spatial dataset exploration both effective and efficient.

Improving Access Efficiency for Spatial Databases
E N D
Presentation Transcript
Improving Access Efficiency for Spatial Databases Amr El Abbadi Computer Science Department University of California, Santa Barbara
Collaborators • Divyakant Agrawal • Current Graduate Students: • Alireza Aghili • Ying Feng • Abhishek Gupta • Huagang Li • Lin Qiao • Ozgur Sahin • Chengyu Sun • Hailing Yu
Roadmap • Browsing large spatial dataset • Spatial join selectivity estimation • Hardware accelerated spatial selection and join
Browsing • Alexandria Digital Library (ADL) • Started in 1995 • A repository for geo-referenced materials • 6,000,000+ records • Browsing Service • Motivation • Explore large spatial datasets efficiently • Make educated queries • Challenges • 2-dimensional objects • Various spatial relations
Browsing Service Prototype • Modeled after ADL query client • Spatial footprint, temporal coverage, subject type, format type … • Intersection and Containment • Return selectivity instead of actual records • Hundreds of queries (“tiles”) all at once
Histogram-based Approach • Performance is independent of dataset size • Histograms for point data is trivial • More difficult for rectangular objects 3 0 1 1 1 2 1 2
Problem Formulation • Given • Rectangular objects • Rectangular queries • A pre-defined grid • Return • selectivity for intersect, contains, contained queries • Requirements • Exact answers, or • Good estimations • FAST!!
Selectivity for Intersection Queries • [BeigelT98], [JinAS00] • Histograms for rectangle objects • Exact query selectivity • Constant query response time • Intersection query only
9-Intersection Model … • [EgenhoferH94] • The spatial relation between two objects P and Q can be defined by the intersections of their interiors, exteriors and boundaries. P Q P contains Q P.I Q.I P.I Q.B P.I Q.E P.B Q.I P.B Q.B P.B Q.E P.E Q.I P.E Q.B P.E Q.E
…9-Intersection Model contains covers overlaps meets contained covered equals disjoint
Contains Contained Overlaps Disjoint Interior-Exterior Model … • Four intersections • Five spatial relations P.I Q.I P.I Q.B P.I Q.E P.B Q.I P.B Q.B P.B Q.E P.E Q.I P.E Q.B P.E Q.E Neq Ncs Ncd No Nd Equals
… Interior-Exterior Model • Neq = 0 |S| • nee = |S| is the size of the dataset • nii is the number of intersecting objects
Euler’s Formula • F – E + V = 2 • For example • 10 faces (including the exterior face) • 24 edges • 16 vertices • 10 – 24 + 16 = 2
Beigel-Tanin’s Corollary • Fi – Ei + Vi = 1 • For example • 9 interior faces • 12 interior edges • 4 interior vertices • 9 – 12 + 4 = 1
-1 0 -1 1 -1 0 0 0 -1 0 Euler Histogram • [BeigelT98] 1 1 1 1 Conventional Histogram 1 1 1 1 1 1 1 1 Euler Histogram
Compute nii • Selectivity for an intersection query • Sum up everything inside the query • For example: • 1-1+2-1+1-2+1-1+2 = 2 1 -1 2 -2 3 -1 1 -2 2 -2 1 -1 2 -2 2 -1 1 -2 2 -2 1 -1 2 -2 2 1 -1 1 1 -1 1 -1 -1 1 -1 1 1
Recall………. • nii is the number of intersecting objects • What about nei ?
Compute nei • Euler Histogram is a histogram about object interiors. • nii can be computed by summing up every bucket inside the query … • … nei can be computed by summing up every bucket outside the query? • Well, not always. 1 -1 2 -2 3 -1 1 -2 2 -2 1 -1 2 -2 2 -1 1 -2 2 -2 1 -1 2 -2 2
Problem #1: Crossover Objects • Two disconnected intersection regions will be counted separately • Example: 1+1 = 2 • Solution? 0 0 1 0 0 0 0 -1 0 0 0 0 1 0 0 0 0 -1 0 0 0 0 1 0 0 • Life is tough, live with it
Problem #2: Loophole Effect • Intersection regions with a hole will not be counted • Solution? 1 -1 1 -1 1 -1 1 -1 1 -1 1 -1 1 -1 1 -1 1 -1 1 -1 • Assume such objects don’t exist (Ncd = 0) 1 -1 1 -1 1 • Break the loop somehow
Simple EulerApprox • From Interior-Exterior Model: • Assume Ncd = 0 • or
B EulerApprox • For datasets with large objects, so Ncd != 0 • Compute nei’ by breaking the loop A • Objects that are strictly inside Region A, plus • Objects that intersect Region B
Multi-resolution EulerApprox • Multiple Euler histograms • Use EulerApprox at higher levels • Use Simple EulerApprox at lower levels
Experimental Setup • Datasets • ADL Catalog • California Road Segments • SP_SKEW • SZ_SKEW • Data space 360x180 • Histogram resolution 1x1 • Tile-like queries • Each query set covers the complete data space • 2x2, 3x3, … , 20x20 sp_skew sz_skew
Performance - EulerApprox • For ADL dataset • Worst case Average Relative Error for contains queries drop from 120% to about 15% • For SZ_SKEW dataset • Worst case Average Relative Error for contains queries is around 95%
Performance – Multi-resolution EulerApprox • For ADL dataset with 2 histograms • Worse case for contains queries is about 5% • For SZ_SKEW dataset • With 3 Histograms • ARE peak at below 3% (b) With 4 Histograms ARE peak at around 1% (c) With 5 Histograms ARE peak at about 0.5%
Performance - Timing • Timing performed on a PIII 800 desktop • Results • All three algorithms process 12,600 queries under 25ms • Simple EulerApprox and EulerApprox are about twice as fast as Multi-resolution EulerApprox • More details in ICDE ’02
Spatial Join Selectivity Estimation • Efficient browsing techniques are essential for digital libraries with large spatial datasets. • Selection estimation for browsing • Spatial joins are needed for more sophisticated GIS applications and spatial databases. • “Find all French-speaking regions in Europe’’ • Expensive and need optimization
Spatial Join • Find pairs of objects from two datasets that satisfy certain criteria • Intersection Join • Rectangular objects • (a,b) is a join result if • a A • b B • a intersects b A B
SA SB Spatial Join with Geometric Selections (SJGS) • General case • (a,b) is a join result, and • a intersects SA • b intersects SB • Special case • SA = SB = S • Applications • Map overlays • Data analysis • … • Selectivity Estimation • Find the number of results A B
S Spatial Join with Geometric Selections (SJGS) • General case • (a,b) is a join result, and • a intersects SA • b intersects SB • Special case • SA = SB = S • Applications • Map overlays • Data analysis • … • Selectivity Estimation • Find the number of results A B
Related Work … • [AnYS01] • Geometric Histogram • Number of intersection points / 4 • Perform well for full set spatial join • Do not handle selections
… Related Work • [MamoulisP01] • Histogram-based approach • Complete Solution for SJGS • General cases • Multi-way join • Strong Uniformity Assumption • Object centers are uniformly distributed • Objects have roughly same widths and heights
1 1 2 2 3 0 0 1 1 1 1 1 2 2 2 0 0 1 1 1 1 1 2 2 2 1 1 2 1 1 1 1 2 2 2 1 1 1 0 0 1 1 2 2 2 1 1 1 0 0 Euler Histogram for SJGS (1x1+2x2+1x1+2x1) – (1x1+1x1+2x1+1x1) + (1x1) =4
0 1 0 1 0 1 1 0 0 0 0 0 0 1 1 0 1 1 1 1 0 1 1 0 0 0 0 0 1 0 0 1 0 1 1 0 Euler Histogram Revisited • Limitation • Cannot represent fractions • Solution • More information per bucket
0 p1 1 0 p2 1 p0 = 1 Generalized Euler Histogram Framework … • pk is the probability of a set of objects intersecting another set of objects inside bucket hk
… Generalized Euler Histogram Framework • Calculate p2 • Probabilistic Model: assumptions about the data distribution inside a bucket • Statistics: average height , average width, average area … HA: HB:
Possible Probabilistic models • [MamoulisP01] model • Uses average object height and width • [AnYS01] model • Uses average object height, width and area. • [SunAE02] hybrid model • Uses a hybrid of two models
Discussion Estimation is important for performance optimization in GIS and spatial databases. More details in EDBT ‘02. Many issues remain: • Explore alternative probabilistic models • General SJGS queries • Alternative queries, e.g., containment
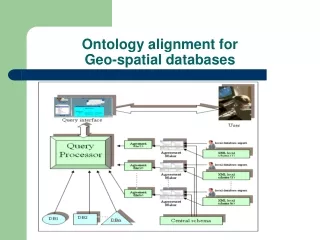
Spatial Query Processing • Filtering Step • MBR / Index • Find candidate objects • Refinement Step • Polygons • Find final results
Spatial Query Processing • Filtering Step • MBR / Index • Find candidate objects • Refinement Step • Polygons • Find final results
Spatial Query Processing • Filtering Step • MBR / Index • Find candidate objects • Refinement Step • Polygons • Find final results
Refinement • Costs • I/O • Computation • Spatial Selection • For polygon objects, both costs are significant [KothuriR01] • Spatial Join
Computation Cost • Complexity of the data • Alaska has more than 70,000 vertices • Arbitrary shape • Concave • Non-simple • Complexity of the algorithms • O(NlogN) intersection test • O(N2) distance calculation
Reducing Computation Cost • Better filtering for intersection queries • Convex hull, n-corner, MER … [BrinkKSS94] • Tiling [ZimbraoS98, BadawyA99, KothuriR01] • More efficient intersection test • TR* Tree [BrinkoffKSS94]
Graphics Hardware • Handles points, lines, and polygons • Fast • Real-time simulation, VR, computer games … • Sophisticated • Graphics processor • Geforce4: 63M transistors • General Processor • AthlonXP: 37.5M transistors • Pentium4: 55M transistors • Ubiquitous • From workstations to desktops to laptops
Graphics HW for Non-Visualization Applications • Interference and Collision Detection • [ShinyaF91] • [RossignacMS93] • [BaciuWS99] • Generalized Voronoi Diagram • [HoffCKLM99] • 2D Intersection Detection • [HoffZLM01]