Mastering Layouts in ArcGIS: A Guide for Environmental Scientists
This module introduces environmental scientists to the art of data visualization in ArcGIS, emphasizing the critical difference between Data View and Layout View. Learn the fundamentals of cartography, including the effective use of map elements such as scale bars and north arrows, to create polished and communicative maps. Discover layout tools that enhance the quality of your maps and explore templates that simplify the mapping process. Achieve professional results whether printing or exporting for digital use, ensuring your maps effectively convey geographic information.

Mastering Layouts in ArcGIS: A Guide for Environmental Scientists
E N D
Presentation Transcript
Introduction to ArcGIS forEnvironmental ScientistsModule 1 – Data VisualizationChapter 4 - Layouts
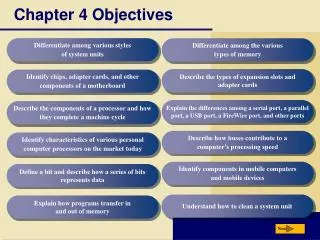
Chapter 4 Objectives • Explore the differences in functionality between Data and Layout views • Learn the cartographic basics • See how layout tools and map elements are used to give your map a ‘finished’ look
Data View vs. Layout View Data View Layout View Is used to create the layout of a map and create final product Contains the elements that will be used in map, such as scale bars, north arrows, etc. Has layout specific tools activated Can contain multiple data frames, as well as tables, graphs, images and text • Is used to view, manipulate, query and analyze data • Provides a more close-up view than layout • Is generally used to get data ready to be ‘mapped’ • Data Frame contains all content that will appear in the map
Switching Between Views Switch to Layout View Switch to Data View Two ways to switch between views: through the View menu using the command buttons Switch to Data View Switch to Layout View
Data Frames in Layout View Map documents support multiple data frames Map elements can be added to each frame Useful for providing overview context and large scale detail on the same map No real limit to the number of data frames that a map can contain
Layout Tools LayoutTools Provide the ability to manipulate ‘map’ while under construction Allow user to zoom in/out, focus, change template, etc. Are valuable for achieving a quality finished product Can be docked anywhere on the GIS interface
Cartographic Basics • Maps should be attractive • Use of color should be meaningful: • Red draws attention to important features or text • Graduated color ramps imply gradation in features being mapped (e.g. dark to light = low to high elevation) • Use of symbols should enhance map’s readability • Items in the map (geographic content/elements/text) should be balanced • Mapped information should be concise (don’t overwhelm the reader!) • Above all, the map should effectively communicate the geographic information you are trying to convey
Templates Pre-developed map documents that only require the addition of data and text Make the job of map making much easier Very useful for maintaining consistency – several map makers in one group ESRI provides several map templates with the software Users can also create their own Access in Layout View through the Change Layout Tool Sample template Change Layout tool
Placement Tools ruler guide Several tools are available for aligning items on the map: Rulers Guides Grids Margins Items on map can be ‘snapped’ to proper location Accessible by right-clicking in the Layout View window grid
Other Alignment Tools Useful for managing size, location and order of objects: Order Nudge Align Distribute Rotate or flip Accessible by right-clicking one or more selected items Menu accessed by right-clicking a selected map item
About Map Elements • Maps should generally consist of the following map elements: • Title • Legend • Scale Bar • North Arrow • Projection Information • Author’s Name • Date • Data Source(s)
Adding Map Elements Map elements are accessed through Insert menu Only active in Layout view Map elements can be extensively customized Properties menu for elements are accessed by right-clicking on a selected item Insertmenu
Final Products Final map product can be printed, exported as a digital image, or published to an internet server Export formats are numerous and may be determined based on map purpose (i.e. publication vs. poster) Local graphics folks will often have a preferred format Resolution of digital output should exceed 100 dpi Output options available from File Export Map…