Download
1 / 28
280 likes | 307 Vues
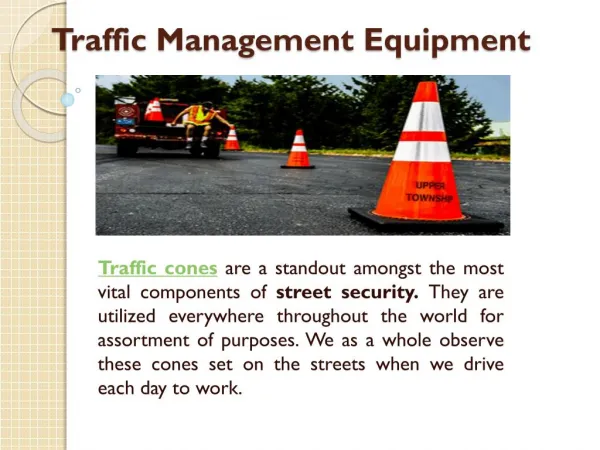
The Metropolitan Houston Traffic Safety Program aims to reduce serious crashes by implementing road improvements, identifying hazardous areas, leveraging funding, and conducting safety studies. By focusing on high-risk behaviors and populations, improving pedestrian and bicycle safety, and enhancing truck safety, the program addresses critical safety issues in the Houston-Galveston region. Various safety activities and partnerships promote a comprehensive approach to enhancing road safety in the area.

E N D
The Metropolitan Houston Traffic Safety Program Houston-Galveston Area Council Houston, TX
Seriousness of Problem • 1998-2000: Houston region - 243,616 serious crashes inc. 1,793 fatalities and 274,926 persons injured • The region accounted for: • 26% of all statewide crashes • 27% of all statewide injury crashes • 17% of all statewide fatal crashes • The region has 22% of the statewide population • and, approximately, 21% of the statewide VMT • Likelihood of a fatal or injury crash was: • 36% higher than statewide average • 145% higher than national average
Purpose of the Program • Build a traffic safety program that can reduce crashes • Map the crashes • Identify hazardous locations and area • Conduct the necessary preliminary engineering Implement roadway improvements Identify funding sources Leverage local investment with State and Federal funds Support other safety efforts Enforcement Education Safety partnerships
Task: Build a GIS-based Crash Information System • Obtained crash data for entire system • State roads • Local roads • Obtain data on an annual basis • Developed geo-referencing methodology • Added supplementary data sets (VMT) • Developed crash analysis tools
Task: Identify Conditions Affecting Crashes • Improper driving behavior • High-risk population • High-risk cities & counties • High crash roadways and intersections (hot spots)
High-risk Behaviors: 1998-2000 • RegionU.S.* • Speeding 39%13% • Failing to yield 20%19% • Failing to stop 11%9% • Running a red light 8%5% • DUI 7%7% • (However, involved in 37% of fatal crashes/39% nationally) • Following too close 3%3% • Improper turn 2%2% • * National Safety Council. U.S. average for 1999. Fatal and injury crashes only
High-risk Populations • RegionU.S.* • Teenagers 21%16% • (9% of driving age population/5% nationally • 17% in fatal crashes /14% nationally • 19% in incapacitating injury crashes) • Elderly (65+) 8% 8% • (9% of driving age population/13% nationally • 11% in fatal crashes/13% nationally • 9% in incapacitating injury crashes) • Male drivers 79% - (Compared to 58% for females • 1.7 times more likely to be in fatal crash/1.4 nationally) • Pickup truck drivers 31% 31% • (More likely to be involved in DUI crash) • * National Safety Council. U.S. average for 1999. All crashes.
City Crash Risk (Crashes Per 100 Million VMT) CityCrash risk Galveston 337 Baytown 334 Rosenberg 320 Pasadena 290 Conroe 247 Houston 231 Texas City 211
Task: Conduct Safety Studies • Identify hazardous locations • Partner with local government, TxDOT • Conduct engineering study • Make mitigation recommendations • Mitigate hot spot
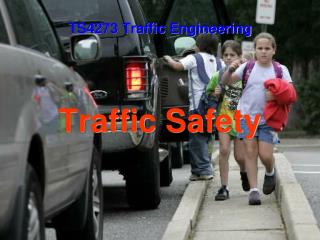
Task: Improve Pedestrian and Bicycle Safety • Have identified areas that are hazardous • for pedestrians and bicyclists (‘hot spots’) • Information is used for bike/ped planning • Examine sidewalk, traffic control and pedestrian • flow dynamics to identify mitigation measures
Task: Improve Truck Safety • Truck crashes a major problem • 27% of the State’s truck crashes • Information provided on location of crashes • Support Houston Police Department’s • truck weighing efforts • TxDOT has implemented “no truck in • left lane” policies on several freeways
Task: Develop Strategic Safety Plan • Have identified 344 major crash hot spots • (78+ crashes between 1998-2000) • Estimating benefits and costs of mitigating • Programming into RTP
Costs and Benefits of Hot Spot Mitigation (Preliminary) Annual Number Estimated Estimated Type of Facility Number of Crashes Cost to Mitigate Annual Benefit Freeway 150 7,766 $75 million $58 million Intersection between freeway & arterial road 70 3,756 $35 million $28 million Arterial road 124 4,930 $62 million $37 million
Other Safety Activities • Safety services • Train local planners in safety planning • Safety courses for judges, Mayors, etc. • Provide safety materials for schools • Safety partnerships • Governmental(TxDOT, DPS, local jurisdictions) • Private, non-profit (AAA, insurance, associations) • Community groups • Promoting good design principles • Review project designs for safety • Encourage constituents to include safety in design