Download
1 / 30
310 likes | 472 Vues
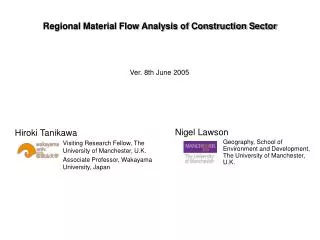
Regional Material Flow Analysis of Construction Sector. Ver. 8th June 2005. Hiroki Tanikawa Visiting Research Fellow, The University of Manchester, U.K. Associate Professor, Wakayama University, Japan. Nigel Lawson

E N D
Regional Material Flow Analysis of Construction Sector Ver. 8th June 2005 Hiroki Tanikawa Visiting Research Fellow, The University of Manchester, U.K. Associate Professor, Wakayama University, Japan • Nigel Lawson • Geography, School of Environment and Development, The University of Manchester, U.K.
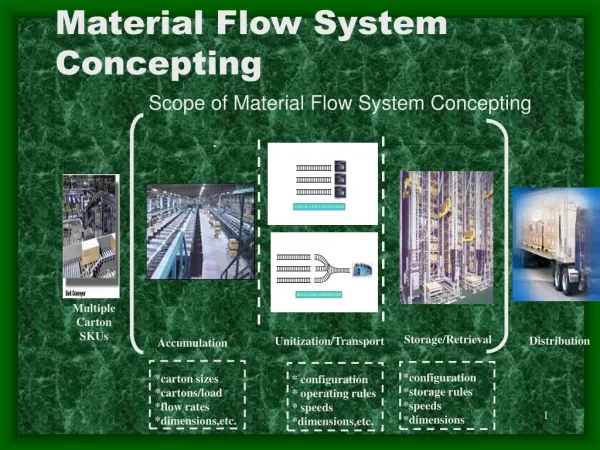
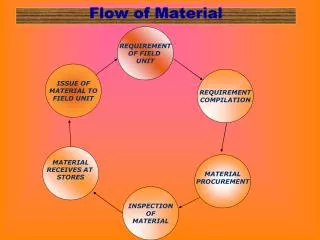
Material Flow of Construction Sector Natural resources Recycled Material Recycle Plant Processing Transportation Construction Material Construction Demolition Landfill Building Roadway Railway Bridge Tunnel ….. Material Input Addition to Stock Quantification of these materials is quite useful. ‘cause it needs long term planning for dealing with these huge materials. Material Stock Material Output
Metabolism of City Past Materials Energy Materials Demolition Energy Current • If we could know these pattern of metabolism, • we can think about… • How much material we need for our life. Future Material Flow of our life • Future Waste Planning. • Balance of Demand / Supply of Const. Materials with recycling system. • Future Situation of Urban Morphology -> Could help to estimate Urban Heat Island, and Energy demand. Demolition Materials Energy Materials Recycle Landfill Demolition Energy Future
Making Historical GIS… 2.4 km 7.7 km2 Paper Maps 1896 - current Aerial Photos 1920 – current 3.2 km Other Photos and Picture 1850 - current Adding some attributes of “Urban Morphology Types” , “Floors of each Building”, “Width of Roadways”.
Historical 3D GIS database Salford Quay and Old Trafford2004
Historical 3D GIS database Salford Quay and Old Trafford1990
Historical 3D GIS database Salford Quay and Old Trafford1980
Historical 3D GIS database Salford Quay and Old Trafford1972
Historical 3D GIS database Salford Quay and Old Trafford1953
Historical 3D GIS database Salford Quay and Old Trafford1932
Historical 3D GIS database Salford Quay and Old Trafford1908
Historical 3D GIS database Salford Quay and Old Trafford1896
Historical 3D GIS database Salford Quay and Old Trafford1849
For estimating Metabolism using Historical GIS database… Material Intensity by material type by structure type by time Metabolism pattern for future estimation Metabolism of construction sector Material Stock / Flow
Material Mass, Intensity of building(Traditional Brick base Flat) *Concrete include Cement, Aggregate, Water
Material Mass, Intensity of building (Newly Medium Flat) *Concrete include Cement, Aggregate, Water
Material Mass, Intensity of building (Traditional Brick-based Factory) 37 m 9 m 7 m 13 m *Concrete include Cement, Aggregate, Water, **NOT include material inside buildings
The Component parts of Typical Pavement Roads in England Permitted Recycled Constituents Materials From SHW 2004 Surface / Wearing Course* Recycled Asphalt Up to 10% use of recycled material 5-10cm Bituminous or Cement Bound Pavement Materials 900 Series of SHW Up to 50% of hot asphalt, 100% of Cold process asphalt Recycled Asphalt Binder Course Base Course 5-10cm Pavement Sub-base: Upper Layer 5-20cm Compacted Granular Foundation Materials Unbound Granular Materials 600 Series & 800 Series of SHW 600 series & 800 series allow 100% of recycled aggregates and wide range of secondary aggregates Crushed Slag RCA (Recycled Concrete Aggregate) RA (Recycled Aggregate) Well burnt non-plastic shale Sub-base: Lower Layer Capping 10-20cm Sub-formation (Sub-grade) App. 100cm Inert Material Soil/Compacted fill Motorway Major Road Residential Road Residential Road (Old) Highways Agency, Manual of Contract Documents for Highway Works: Volume 1 Specification for Highway Works, 2004, UK Department of the Environment, Transport and the Regions Research Contract, MP0623, 1999, UK A Guild to Paving in Britain and Ireland, http://www.pavingexpert.com/aggs01.html British Standard *Asphalt weight ratio in wearing course: 4.85% **Quantities and structure will vary depending on the project location. Stone Block 10cm 245kg/m2 Typical Width (A56): 24m = 3.5m * 4 lanes + Centre 2m + Side 4m * 2 Typical Width : 10m = 3m * 2 lanes + Side 2m * 2 Typical Width (M60): 33m = 3.5m * 6 lanes + Centre 4m + Side 4m * 2
The Component parts of Typical Railway 143.5 cm app.20 cm 60 cm Rail track: 40*2 - 50*2 kg/m (PS standard, 1920) Sleeper: 20 cm * 12 cm * 215 cm, @70 kg per 60 cm, 117 kg/m Ballast: thickness 20 cm , @4 cm Aggregate, 1.4 m3/m = 3.0 ton/m
Historical Change of Material Stock #1 1849 1896 1908 1932 1953 1972 1980 1990 2004 The case study area is Salford and Old Trafford in Manchester, U.K, area 7.7km2, population circa 7,500. In 2004, Building Stock 299 ton/cap., Roadway 92 ton/cap., Railway 28 ton/cap.
Historical Change of Material Stock #2 1849 1896 1908 1932 1953 1972 1980 1990 2004 The case study area is Salford and Old Trafford in Manchester, U.K, area 7.7km2, population circa 7,500. In 2004, Aggregate and Stone Block is 28%, 24% of Concrete, 20% of Bricks.
Historical Change of Building Stock 2.2 mil ton 1.3 mil ton 0.6 mil ton 1908 1849 2004 The material which support of lives is app.299 tons / capita.
Metabolism Pattern of Building on Historical Map Built in 2000 Built in 1932 1908 Built in 1908 Built in 1896 1932 2000 Material Mass 1896 1896 1908 1932 2000 time Historical Maps tell “Newly”, “Enhanced” and “Demolished” Buildings Total material mass is accumulating, but the building built in each year is gradually demolished. This is the pattern of metabolism.
Metabolism Pattern of Building on GIS mapping … Buildings built between 1849-1896, in 1932 Buildings built between 1849-1896, in 1980 Number of buildings, built between 1850-1896 Buildings built between 1849-1896, in 1896 We can know the pattern of metabolism using historical GIS database.
Estimate the pattern of metabolism: Building Number of buildings, built between 1850-1896 Percentage of demolished buildings, built between 1850-1896 These are similar to Growth Curve, so estimating these pattern with using Logistic Curve. Fitting Curve? Extended Percentage of demolished Buildings,built between 1850-1896 Estimate these pattern by 9 time period of built year, and by 4 building types…..
Estimate the pattern of metabolism: Demolition Rate of Built Stock Middle / Low Density Residential Average of life span: 101 years Factory Average of life span: 67 years All Buildings Average of life span: 81 years High Density Residential Average of life span: 84 years
Change of Building Stocks in the near future In 2010, Demolition from Building is estimated 6300 tons per year. ↑ 2004 stock in 2010 / 2020 In 2020, Demolition from Building is estimated 5800 tons per year.
Metabolism of City Past Materials Energy Materials Demolition Energy Current • Future works… • Estimation include Roadways and Railways in progress. • Extend Area in Manchester • Visualization of MFA Result for Decision Making Process. • The merit to know the pattern of metabolism, • we can think about… • How much material we need for our life. Future Material Flow of our life • Future Waste Planning. • Balance of Demand / Supply of Const. Materials with recycling system. • Future Situation of Urban Morphology -> Could help to estimate Urban Heat Island, and Energy demand. Demolition Materials Energy Materials Recycle Landfill Demolition Energy Future
Practical Application of Spatial / City-scale MFA Management of “Demand” and “Supply” of Recycling Materials • Understanding changing patterns of urban mass • Efficient use of raw materials • Maximizing / Optimizing Recycling Systems Heat Island Effect and Future Material Stock • Assessing intensity of the Urban Heat Island Effect Flood defense strengthening uses 2 million tons of aggregates per year in the UK. Demolition Waste