Download
1 / 24
291 likes | 1.98k Vues
Presentation Overview. Requested informationProject objectivesPlanning and executionUnit operation backgroundExperimental designResults and conclusionsRecommendations . For what purpose?. Request from Environmental Systems Design They need to finalize their tower design givenWaste gas contains 3% CO20.05N NaOH scrubbing solution at 40 mL/sEmpirical analysis of mass transfer coefficients and effluent compositions of CO2Theoretical analysis for comparison.

E N D
1. Absorption of Carbon Dioxide by a Sodium Hydroxide Solution in a Packed Tower Trevor Carlisle
Thad Ivey
Sara York
ChE 414 Winter 2005
2. Presentation Overview Requested information
Project objectives
Planning and execution
Unit operation background
Experimental design
Results and conclusions
Recommendations
3. For what purpose? Request from Environmental Systems Design
They need to finalize their tower design given
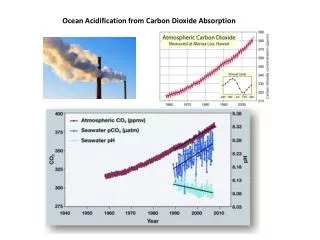
Waste gas contains 3% CO2
0.05N NaOH scrubbing solution at 40 mL/s
Empirical analysis of mass transfer coefficients and effluent compositions of CO2
Theoretical analysis for comparison
4. Objectives Verify calibration data
Find the dependence of KGa and outlet compositions on gas flow
Determine flooding points
Theoretically calculate KGa
Statistically analyze the data
5. Action Items Understand unit operation
Identify safety issues
Calibrate flow meters
DOE and gas sampling
Organize and evaluate the data
Identify appropriate mass transfer relations
Calculate empirical results
Compare with theoretical predictions
Reach conclusions and present results
6. Team member roles Sara- Operations Manager
Run the GC
Ensure Proper tower operation
Responsible for data management
Thad- Safety Manager
Identify safety issues
Develop the safety plan
Monitor safe lab behavior
Trevor- Team Leader
Develop and the project plan
Ensure lab work moves forward
Coordinate group tasks
7. Lessons Learned Do not rush experimental design
Emphasize background information prior to lab work
Do not leave any ambiguity in action items
Perform theoretical calculations prior to experimentation
8. The Gas Absorption Tower Add picture of TowerAdd picture of Tower
10. Mass Transfer with Reaction Mechanism: liquid film controlling Fix mass transfer diagramFix mass transfer diagram
11. The rapid, 2nd order irreversible reaction
13. Theoretical calculation of KGa with the Onda Correlation
14. Theoretical Kga continued . . .
15. Experimental Design Prepare ~0.05N NaOH solution
Standardize scrubbing solution
Vary gas flowrate (100 � 1000 mL/s)
Maintain 3% CO2
Constant liquid flow, 40 mL/s
Add Picture of GC and needleAdd Picture of GC and needle
16. More on experimental design Allow time to reach SS mass transfer
Gas samples taken from top and bottom of tower
GC used for analysis
Peak areas used to determine CO2 composition
Four samples taken per flow setting
Add Picture of Gas ChromatographerAdd Picture of Gas Chromatographer
17. Results: Flooding Theoretical calculation
Superficial Gas flow rate at flooding
=525 lbm/ft2-hr
=6016 lbm/hr with our tower
Add flooding correlationAdd flooding correlation
18. Results
19. Results
20. Results
21. What accounts for theoretical and empirical differences? kL is affected by the 2nd order reaction
Rather, kL = c*kLo, where c is a reaction parameter and kLo is the transfer coefficient without reaction
Wetted surface area, aW, may be decreasing with increased gas flow
The set up is not completely liquid film controlling
22. What accounts for theoretical and empirical differences?
23. Conclusions Theoretical model needs to be re-evaluated by considering reaction effects
The gas phase resistance is not negligible:
KGa= -.0042G + .66 (lbmol/ft3-hr-atm)
CO2 composition in liquid outlet is zero based on mass balance
CO2 composition in the gas outlet varies as a natural log:
%CO2= 1.6ln(G) � 5.2
Predictions of yCO2 in tower outlet are not reliable above flows of 150 ft3/hr
Flooding will occur well above reasonable operating flows
Gf= 6016 (lbm/hr) = 6.19x10⁵ (mL/s)
24. Recommendations Obtain more data closer to flooding
Determine the relation between reaction kinetics and KGa
Use previous experiments contained in journals to anticipate results and complications
Include theoretical calculations as part of the lab work
25. References Perry, Robert H. and Green, Don W. 1997. Perry�s chemical engineer�s handbook (7th Ed). United States of America: R.R. Donnelly and Sons Company.
Nijsing, R.A.O.T., Hendriksz, R.H, and Kramers, H. 1959. Absorption of CO2 in jets and falling films of electrolyte solutions, with and without chemical reaction. Chemical engineering science, 10,88-103.
Rorrer, Gregory L. 2004. Che 411 mass transfer operations lecture notes supplement. Corvallis, OR: Dept. of Chemical Engineering, Oregon State University.
Spector, Norman and Dodge, Barnett F. (year?). Removal of carbon dioxide from atmospheric air. American institute of chemical engineers, (vol?), 827-848.