Download
1 / 23
230 likes | 265 Vues
NOAA's Hurricane Research Division aims to advance understanding and prediction of tropical cyclones through observations, models, and theory to improve forecast accuracy and reduce uncertainty. They focus on enhancing forecast reliability and reducing uncertainty through science, information technology, and observing strategies to quantify and manage risks effectively. The division collaborates with various partners and engages in traditional and new research activities to improve intensity, track, and impacts prediction of tropical cyclones.

E N D
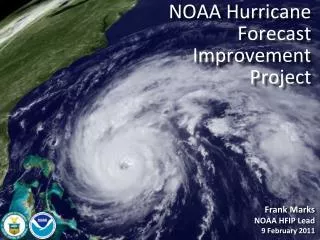
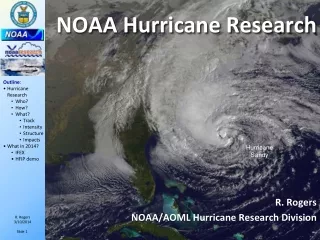
NOAA Hurricane Research R. Rogers NOAA/AOML Hurricane Research Division Hurricane Sandy
GOALS: • Advance understanding and prediction of tropical cyclones (TC) through observations, numerical models, and theory, with emphasis on processes within inner part of storm. • NOAA’s hurricane research focus for >50 years • The goals of this research are to: 1. Advance prediction of TC intensity and structure change (INTENSITY); 2. Improve prediction of TC track (TRACK); and • Enhance ability to diagnose and predict impacts of TC on life and property (IMPACTS) • http://www.aoml.noaa.gov/hrd/ • WHO: • AOML/Hurricane Research Division (36 employees) 19 research, 17 support, 3-4 summer students
Goals • Improve Forecast Accuracy • Hurricane impact areas (track) – 50% in 10 years • Severity (intensity) – 50% in 10 years • Rapid intensity change detection • Storm surge forecast improvements • Extend forecast reliability out to 7 days • Quantify, bound and reduce forecast uncertainty to enable risk management decisions
How to get there? • Science • Improved understanding from combination of observations & models • High resolution coupled models – critical to storm evolution forecasts – especially intensity changes • Techniques to understand, reduce & communicate uncertainty • Information Technology • Increased computing power - run advanced hurricane/global models and reduce uncertainty • IT infrastructure for inter-agency data exchange • Observing Strategy • Improved use of existing and planned systems • Improved Forecaster Products
Traditional TC Research Activities: • Observations, analysis, database, & instrument R&D • Statistical-dynamical model development • Advances in operational models • New HFIP Research Thrusts: • Experimental global and regional hurricane model development • Data assimilation techniques and observing system strategy analysis development • Model evaluation tool development • Socioeconomic research and development Partnership: NCEP, AOC, AOML, ESRL, GFDL, DTC, USWRP, NESDIS/STAR
Joint research programs outside of NOAA with NASA, NSF, and ONR (NSF/PREDICT & NASA/GRIP) Cooperative research with scientists at NCAR, and universities (HFIP and NOPP BAA) Interact with WMOWWRP and THORPEX, and cooperative research with other countries (IWTC-VII) Ensure research benefits NOAA. HOW?: CBLAST DOTSTAR IFEX/TCSP IFEX/RAINEX 6
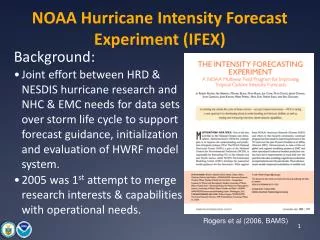
HOW?: NOAA Intensity Forecast Experiment (IFEX) Partnership to improve TC intensity/ structure forecasts • Collect targeted observations • throughout TC life cycle for DA of core circulation • in and around storm scale circulation to evaluate HWRF • in variety of atmospheric/oceanic conditions to assess observed & model TC intensity/structure changes • Improve physical understanding & representation of • Boundary layer • Surface flux • Microphysics • Impact of dry air (SAL) • Rainbands& eyewall http://www.aoml.noaa.gov/hrd/HFP2012/IFEX.html
WHAT?: Current TC research: Track: • Synoptic-surveillance using dropsondes. • Analytical & numerical studies. • Ensemble track forecasting & targeted observations. http:/www.aoml.noaa.gov/hrd/data_sub/assesment.html
Sandy (18L) – init 00Z 23 October Track (continued): • Global Model Ensembles: Single & Multi-model 7-Day forecast – 20 member ensemble GFS/EnKF T382 20 member ensemble Observed http://www.esrl.noaa.gov/psd/forecasts/gfsenkf/ens/
Intensity: • Airborne Doppler radar studies, air-sea interaction studies, and 3-D modeling of TC Vq 150 100 50 100 0 50 150 distance (km) 0 Vr, w distance (km) Airborne Doppler-analyzed wind field Hurricane Katrina, 28 September 2005 http://www.aoml.noaa.gov/hrd/Storm_pages/katrina2005/radar.html
Intensity (continued):Assimilation of data into numerical models Synergy of high resolution forecast and airborne observations P-3 and G-IV observations – superobs (SO) Data assimilation Improving the initial condition in storm core region Improving the high resolution regional forecast Wind intensity at 10 m Hurricane Sandy (2012) F. Zhang (PSU), Aberson, Aksoy, Gamache, Gopal (AOML/HRD)
2012 HWRF Experimental HWRF real-time demo simulations (http://storm.aoml.noaa.gov/hwrfxprojects/?projectName=BASIN) Intensity (continued): • 3-D modeling of TC
Earl 2010, 3-km HWRF Intensity Predictions (credits to Dr.Hua Chen, AOML/HRD/NRC) Warmer sea surface temperatures and no shear Size Predictions Vortex tilt, dry air, and size of the storm Terrain interactions Aug 26/18 27/18 28/18 29/18 30/18 31/18 Northerly shear and dry air impedes the development of circulation Enhanced Water Vapor Equivalents obtained from HWRF in the Life cycle of Hurricane Isaac Intensity (continued): HWRF: Improvement in Forecast Skill
ATL Intensity (continued): • Statistical Models • Since 1997, D-SHIPS most skillful intensity guidance to NHC/TPC. • Incorporates wind field decay after landfall. • Incorporates inner-core SST impact • Evaluation of SHIPS shows average 6-8% increase in forecast skill for storms with inner-core SST estimates. • Developed “Rapid intensification (RI)” index. • Evaluation of RI shows average 5% and 30% improvement for ATL & EPAC. • RI Index has much higher POD than any dynamical model and OFCL in both ATL and EPAC (EPAC easier than ATL) • FAR for RI index comparable to dynamical models and OFCL • Kaplan et al (2009)
Structure: • Land-based radar, surface data, GIS. Development of a real-time surface analysis system. http://www.aoml.noaa.gov/hrd/data_sub/wind.html
Data Coverage HWRF 10m winds H*Wind 10m winds Structure: • Evaluation of Model structure HWRF Forecast (108 h) HWIND analysis
Impacts:Where do we need to be? • NOAA’s National Weather Service (NWS) mission is to fulfill this commitment through building a Weather Ready Nation. • NWS must contribute to hazard resiliency by continually assessing and improving its services to Nation. • Hurricane Sandy (2012): • 147 (72 along US East Coast) deaths • >$75 Billion damage • Major infrastructure losses • Power lost to 8.5 million
What in 2014?: • IFEX 2012-13 • NOAA aircraft flew >400 h • Highlights include Isaac, Leslie, & Sandy (2012), Ingrid and Karen (2013) • For details see: http://noaahrd.wordpress.com/category/ifex-discussion • IFEX 2014 • 2 NOAA WP-3D, G-IV ~750 flight hours (1 June-30 November) • Crews available 2/day missions starting July based from Tampa, FL • Interact with NASA during their HS3 field campaign • HFIP real-time model demonstration
IFEX: Improved Models & Data:Sandy 7 P-3 Flights 26 October– 29 October 2012 TDR-Experiment: Doppler data transmitted in real-time for assimilation into HWRF HWRF/GSI 20121026 00UTC 7 P-3 Flights 23 August – 27 August 2011 • 7 WP-3D TDR missions from 00 UTC 26 – 12 UTC 29 September 2012 at 12 h Doppler sampling (HEDAS/GSI) • 3 G-IV missions (TDR) • Sampled Hurricane Sandy from passage N of Cuba to landfall HWRF/GSI 20121026 00UTC Aberson, Aksoy, Gamache, Gopal (AOML/HRD), Tong (EMC)
IFEX: Positive impact of TDR data on TS Karen intensity forecast Intensity Forecast for Karen (2013) Valid 12 UTC 4 October 2013 80 Best track 75 HWRF without Doppler 70 HWRF with Doppler 65 10-m peak wind (kt) 60 55 50 45 40 35 30 25 20 15 0 12 24 60 36 48 72 84 108 96 120 Forecast hour NHC Forecast Discussion on October 4, 5 PM: “…THE 12Z HWRF RUN SHOWED CONSIDERABLY LESS INTENSIFICATION WITH KAREN COMPARED TO PREVIOUS RUNS AFTER ASSIMILATING DATA FROM THE FROM THE NOAA P-3 TAIL DOPPLER RADAR. THIS MARKS THE FIRST TIME DOPPLER RADAR DATA HAVE BEEN ASSIMILATIED INTO AN OPERATIONAL HURRICANE MODEL IN REAL TIME. ..”
HFIP Demonstration GFS Track Forecast Improvements 2012 2006-2008
HFIP Demonstration GFS Track Forecast Improvements
Communicating in the field • Our blog • http://noaahrd.wordpress.com • HRD Web page • http://www.aoml.noaa.gov/hrd • Facebook • http://www.facebook.com/noaahrd • Twitter • http://twitter.com/#!/HRD_AOML_NOAA Tweets from the eye Visiting scientist program