NOAA 2018 Hurricane Season Outlooks
220 likes | 422 Vues
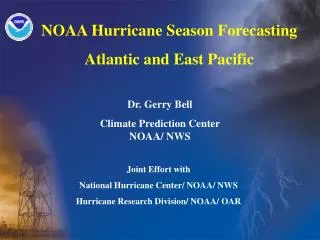
NOAA 2018 Hurricane Season Outlooks. Dr. Gerry Bell Lead Seasonal Forecaster Climate Prediction Center NOAA/ NWS/ NCEP. Collaboration With National Hurricane Center/ NOAA/NWS/NCEP Hurricane Research Division/ NOAA/OAR/AOML Central Pacific Hurricane Center NOAA/NWS.

NOAA 2018 Hurricane Season Outlooks
E N D
Presentation Transcript
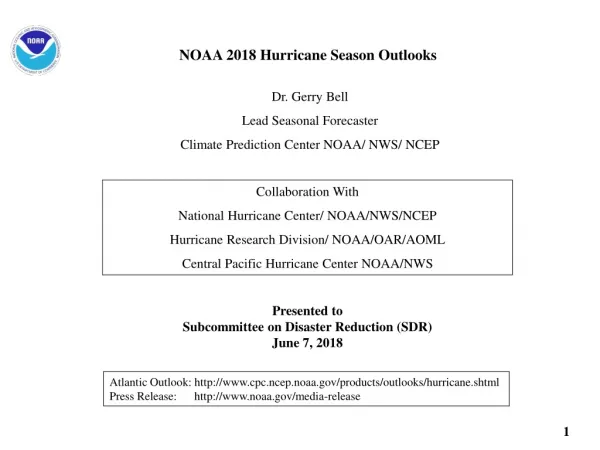
NOAA 2018 Hurricane Season Outlooks Dr. Gerry Bell Lead Seasonal Forecaster Climate Prediction Center NOAA/ NWS/ NCEP Collaboration With National Hurricane Center/ NOAA/NWS/NCEP Hurricane Research Division/ NOAA/OAR/AOML Central Pacific Hurricane Center NOAA/NWS Presented toSubcommittee on Disaster Reduction (SDR)June 7, 2018 Atlantic Outlook: http://www.cpc.ncep.noaa.gov/products/outlooks/hurricane.shtml Press Release: http://www.noaa.gov/media-release 1
Outline • Prediction regions • 2018 Outlooks for the Atlantic, eastern Pacific, and central Pacific • Science behind the outlooks • Multi-decadal cycles in hurricane season strength and hurricane landfalls • Summary 2
NOAA’s Hurricane Outlook Regions Atlantic Basin Storm Tracks 1980-2005 Central and Eastern North Pacific Storm Tracks 1980-2005 Eastern Pacific Central Pacific Main Development Region (MDR) 140oW Figure Courtesy of Wikipedia NOAA issues seasonal hurricane outlooks for the Atlantic basin, the central North Pacific, and the eastern North Pacific. 3
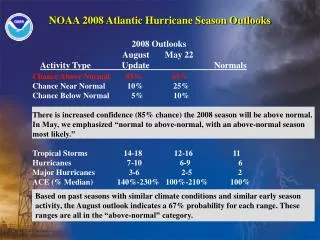
How and When the Outlooks are Issued • Outlooks issued in late May • Press release, and technical write-up, social media • Atlantic outlook has national press conference • Central Pacific outlook has press conference in Hawaii • Atlantic outlook is updated early August- • Coincides with peak of season (August-October). 4
NOAA’s 2018 Hurricane Season Outlooks Issued May 23-24 • Outlooks are for the overall seasonal activity. They are not a hurricane landfall prediction and do not imply levels of activity for any particular location. A near- or above-normal season is predicted for each region: A lot of activity. Central Pacific Near- or Above-Normal (80%) 3-6 Tropical Cyclones Average is 4-5 TCs Atlantic Near- or Above-Normal (75%) 10-16 Named Storms 5-9 Hurricanes 1-4 Major Hurricanes Averages are 12 NS, 6 H, 3 MH Eastern Pacific Near- or Above-Normal (80%) 14-20 Named Storms 7-12 Hurricanes 3-7 Major Hurricanes Averages are 15 NS, 8 H, 4 MH We do not expect the 2018 Atlantic hurricane season to be as active as last year, which produced 17 named storms, 10 hurricanes and 6 major hurricanes. Named storms (39+ mph) Hurricanes (74+ mph) Major Hurricanes (Cat. 3-4-5, 111+mph). 5
NOAA’s Approach to Making Hurricane Season Outlooks Global climate patterns strongly influence hurricane conditions for months/ seasons/ decades at a time. This is how we do it By predicting key climate patterns, we can often predict the hurricane-influencing conditions, and therefore predict the strength of the upcoming hurricane season. • Extensive monitoring and analysis • Global ocean and atmosphere data: Allows us to monitor and study global weather and climate patterns on a daily basis. • Research: Over 30+ years research into hurricanes and global climate patterns • Suite of statistical prediction tools and climate model predictions (developed in last 10 years) 7
Hurricanes Require Weak Vertical Wind Shear Vertical wind shear refers to the change in wind speed and direction going up through the atmosphere. Hurricanes destroyed by strong shear-large change in winds Hurricanes need weak shear- little change in winds. 40,000 ft. 40,000 ft. Upper-Level Winds Upper-Level Winds Looking sideways through storm clouds EYE Eye Wall Eye Wall Ocean Ocean Lower-Level Winds Lower-Level Winds Lower clouds and circulation Strongly Sheared Storm Strong Hurricane Looking down on storm clouds Upper clouds 8
These Climate Patterns Strongly Influence Atlantic Hurricane Season Atlantic Multi-Decadal Oscillation (AMO): Multi-decadal cycles in Atlantic hurricanes El Niño/ La Niña: Year-to-year changes in Atlantic hurricanes Climate Pattern for High-Activity Era El Niño: Fewer Hurricanes Warmer Ocean Stronger Shear Warm Phase of AMO Warm, Wet Stronger, wetter West African Monsoon Warmer Ocean Weaker Shear Main Development Region La Niña: More Hurricanes Climate Pattern for Low-Activity Era Weaker Shear Cooler Ocean Cool, Dry Cool Phase of AMO Weaker, drier West African Monsoon Cooler Ocean Stronger Shear Main Development Region Predicting these climate patterns and their interaction is the basis for making NOAA’s seasonal hurricane outlook. 9
Expected Atlantic Conditions for 2018 The 2018 Atlantic outlook reflects predictions for: ENSO-neutral (No El Niño or La Niña) or weak El Niño, Near-average ocean temperatures in the Main Development Region, Near- average or weaker wind shear associated with ongoing warm phase of AMO and high-activity era. Expect ENSO-neutral, possible El Niño Near-average ocean temperatures (cooler than 2017) Near-average or weaker vertical wind shear (stronger than 2017) Atlantic Main Development Region 10
Multi-Decadal Cycles in Hurricane Season Strength and Hurricane Landfalls 11
25-40 Year Cycles in Atlantic Hurricanes Time series of Atlantic major hurricanes since 1950 5-yr Running Mean 1981-2010 Average • Because of the Atlantic Multi-Decadal Oscillation, hurricane seasons have 25-40 cycles. • We are still likely in a high-activity era for Atlantic hurricanes that began in 1995. • High-activity era’s feature more, stronger, and longer-lived storms: • Major hurricanes: more than double • Hurricanes: 30%-50% increase • Named storms: 20%-40% increase 12
U.S. Hurricane Landfalls During High- and Low-Activity Eras 37% Increase 10% Increase 85% Increase During high activity eras, both the U.S. Atlantic and Gulf coasts experience more landfalling hurricanes. Largest increase in hurricane landfalls is seen along the Atlantic coast. U.S. sees almost a doubling of seasons with multiple landfalling hurricanes. 13
Coastal Population Growth High Activity Era High Activity Era Low Activity Era Low Activity Era Variable Exponential growth along the Atlantic and Gulf Coasts has put far more people and property ($$$) in harm’s way. 80+ million people are considered Atlantic or Gulf Coast residents that can be impacted by a tropical storm or hurricane. 14
Summary We expect near-normal or above-normal hurricane seasons this year in all three hurricane regions (Atlantic, eastern Pacific, and central Pacific). This is a lot of activity. • Last year, major hurricanes Harvey, Irma, and Maria caused over $265 Billion in damage. • Hurricanes NOT just a coastal event; can impact millions in many different ways. • Prepare for every hurricane season regardless of the outlook. • High-activity era for Atlantic hurricanes began in 1995, following decades of exponential growth in coastal regions. More hurricanes and more people in harm’s way. • Emergency planning/ execution is far more challenging, demands much longer forecast lead times. 15
Preparedness www.ready.gov www.nhc.noaa.gov • Tropical storms and hurricanes can cause tremendous damage, flooding, death. • Preparedness situations can differ: Location, children, pets, finances, property, transportation, structure of home, etc. • Tropical storms and hurricanes produce many different kinds of storm conditions. • Your preparedness plans must reflect both your personal situation and the storm conditions you might expect. • Immediate coastal impacts- Storm surge, evacuation, complete destruction • Non-coastal impacts • Inland flooding • Strong winds/ downed trees and power lines • Tornadoes S2
Landfalling Major Hurricanes Last Year (2017) Major hurricanes Harvey, Irma, and Maria cause over $265 Billion in damage. S3
Major Hurricane Landfalls Last Year Major Hurricane Harvey: First MH to strike the U.S. since 2005 Intense Rain Bands extend 100’s of miles from Harvey Eye Eye wall (115-130 mph winds) Harvey Rainfall Totals (Inches) < 20 20-25 25-30 30-35 35-40 40-45 45-50 50-55 55-60 60-65 Harvey Tornadoes (52) Hurricanes produce storm surge, devastating winds, flooding, mud-slides, tornadoes S4
Major Hurricane Irma: Last Year:Cat. 5 Storm with 155+ mph winds Double eye-wall north of Puerto Rico Radar Image Eye Inner eye-wall Outer eye-wall Puerto Rico Yellow/ orange/ Red shading indicates heavy rainfall Eye wall diameter is as big as Puerto Rico Cities, states, entire islands are tiny compared to a big hurricane S5
Major Hurricane Irma: Last Year- Cat. 5 with 155+ mph winds S6
Major Hurricane Maria: Last Year: Cat. 5 with 155+ mph winds Maria Making Landfall in Puerto Rico Last Radar Image before Radar was destroyed Maria’s Track (Black) and Forecasted Tracks (Red) Puerto Rico: $90+ billion in damage Puerto Rico Intense Rain Bands Puerto Rico Dominica Maria moved directly across Dominica and Puerto Rico with 155+ mph winds. Inner eye-wall Outer eye-wall Yellow/ orange shading indicates heavy rainfall Excellent forecasts for Maria (Red lines) from the time it formed. Predictions undoubtedly helped save countless lives, especially coming on the heels of MH Irma just a few weeks earlier. S7