Download
1 / 12
120 likes | 210 Vues
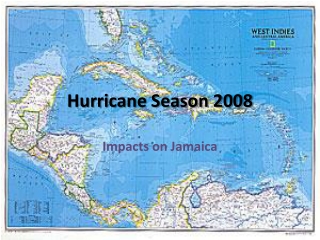
The NOAA's update for the 2008 Atlantic hurricane season outlook indicates an 85% chance of above-normal activity. Factors like warmer SSTs and the lingering La Niña influence contribute to the forecast. Historical data shows a likely ACE range between 140%-230% of the median, placing it in the "above-normal" category. The transition into the current active Atlantic hurricane era has been driven by climate patterns favoring warmer and wetter conditions. Lingering La Niña impacts and anomalies in equatorial convection and winds further shape the forecast for the remainder of the season.

E N D
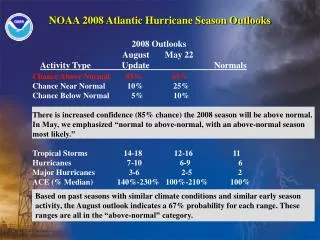
NOAA 2008 Atlantic Hurricane Season Outlooks 2008 Outlooks August May 22 Activity Type Update Normals Chance Above Normal 85% 65% Chance Near Normal 10% 25% Chance Below Normal 5% 10% There is increased confidence (85% chance) the 2008 season will be above normal. In May, we emphasized “normal to above-normal, with an above-normal season most likely.” Tropical Storms 14-18 12-16 11 Hurricanes 7-10 6-9 6 Major Hurricanes 3-6 2-5 2 ACE (% Median) 140%-230% 100%-210% 100% Based on past seasons with similar climate conditions and similar early season activity, the August outlook indicates a 67% probability for each range. These ranges are all in the “above-normal” category.
Expected August-October 2008 Conditions The above conditions are now in place as predicted in May, and have already been associated with strong early-season activity over the tropical Atlantic and Caribbean Sea. These conditions reflect the ongoing active Atlantic hurricane era, warmer Atlantic SSTs, and a lingering La Niña influence.
Likely Activity for Remainder of 2008 SeasonAugust 7th through -November 30th 2008 Activity to Date • 5 Tropical Storms • 2 Hurricanes • 1 Major Hurricane (Bertha); longest July storm on record • ACE index = 46% of median---Third highest on record • 9-13 Named Storms • 5-8 Hurricanes • 2-5 Major Hurricanes (Cat. 3-5 on Saffir-Simpson Scale)
Historical Atlantic Seasonal Activity • NOAA’s updated 2008 Atlantic hurricane season outlook indicates a likely (67% chance) ACE range of 140%-230% of the median. This is well within the “above-normal” category.
SST Departures (oC) in the Tropical Atlantic Ocean Sea-surface temperature (SST) departures in the main hurricane development region (green box) have warmed 0.25oC between March-April (Left) and June (Right). July SST departures averaged +0.33oC, consistent with an above-normal season.
Lingering La Niña Influence 4-Week SST Departures (oC) in the Tropical Pacific Ocean La Niña has dissipated as indicated by a warming of the sea-surface temperature (SST) departures across the central and east-central equatorial Pacific between early April (Left) and July (Right). However, a horse-shoe shaped pattern of SST departures linked in part to La Niña still persists. This pattern suggests the lingering La Niña-related pattern of tropical convection will continue, and that ENSO will not hinder Atlantic hurricane activity.
Lingering La Niña influenceAnomalous Equatorial Convection and Winds OLR Anomalies 850-hpa Zonal Wind Anomalies (August-November) Longitude Longitude • Lingering La Niña impacts near the date line include suppressed convection (orange/red- Left panel) and weaker tropical easterly winds (blue-Right panel).
Transition to Current Active Atlantic hurricane era Observedvs. Multi-Decadal Signal Explained variance = 82%. The transition into the current active Atlantic hurricane era is captured by a phase change in tropical multi-decadal signal (Bell and Chelliah, J. Climate, 15 Feb. 2006).
Underlying Climate Pattern forActive Atlantic Hurricane Era Warmer Warmer Wetter Drier The combination of an enhanced West African monsoon system and suppressed convection over the Amazon Basin has been in place since 1995. This pattern favors expanded upper-level easterlies (green arrow) and weaker trade winds (blue arrow), which contribute to warmer SSTs, reduced vertical wind shear, and a more favorable African easterly Jet.
Mean Divergent Anomalies at 200-hPa 1995-2005 The current upper-level divergent pattern (Top) is consistent with the ongoing active hurricane era (Bottom). Key features include an enhanced West African monsoon system and anomalous convergence over the eastern Amazon Basin.
Mean Circulation Anomalies at 35,000 Feet 1995-2005 Current upper-level circulation anomalies (Top) indicate an enhanced subtropical ridge in both hemispheres across Africa and the Atlantic Ocean (red shading in NH, blue shading in SH). These patterns are also consistent with the ongoing active hurricane era (Bottom).
700-hpa Circulation Anomalies • The active hurricane era also features westerly anomalies (solid lines, Top), indicating weaker tropical easterlies, extending from the eastern Pacific to Africa. • This pattern is associated with increased cyclonic shear (red shading) across the main development region (green box). These patterns are now in place (Bottom). • These anomalies produce an exceptionally favorable African Easterly Jet, and significant development of African easterly waves in the main development region.