Geographic Access Gravity Model
Geographic Access Gravity Model. Statement of Problem (Measurement) The Theory and Method (Potential Accessibility) Applications (Preliminary Maps) Future Directions (Data & Model Improvements) Feedback from Others (Discussion). 1. The Problem(s) - Measurement.

Geographic Access Gravity Model
E N D
Presentation Transcript
Geographic Access Gravity Model • Statement of Problem (Measurement) • The Theory and Method (Potential Accessibility) • Applications (Preliminary Maps) • Future Directions (Data & Model Improvements) • Feedback from Others (Discussion) 1
The Problem(s) - Measurement • How to MEASURE geographic access to health care providers and facilities? • The Solution - Develop a reliable method to MEASURE (and compare) the distribution of facilities/providers and the population. • Reliable MEASUREMENT requires a geographic framework in which to collect and organize observations. 2
The Problem(s) • Reliable MEASUREMENT requires a common scale that allows for comparison of values. • Reliable MEASUREMENT requires a method to handle arbitrary boundaries imposed by a data collection geographic framework. 3
The Geographic Framework - ZIP Codes • Health care data (patient, provider, facility, etc.) have many geographic (locational) components. • Some geographic components are; geographic coordinates, county, census block and tract, etc.). • An address with a ZIP Code is a widely used geographic component (our choice). 4
NM ZIP Codes • US Postal Service delivery areas. • Some ZIP Codes do not have rural delivery and mail is picked up at the Post Office. • There can be multiple ZIP Codes per post office (delivery and no delivery). • DGR has prepared a ZIP Code base map for NM with 400 ZIP Codes for mapping HPC Data (new ZIP Codes are being added - Currently 403). • We added (estimated) boundaries for 125 ZIP Codes (USPS review). 5
DGR’s ZIP Code Maps 1999 and 2002
A Common Measurement Scale • Service Capacity Standards (traditional measure - Fed. and State guidelines). • Ratio of provider or facilities per population. • Can be expressed as either: • One M.D. per 1,500 persons (Prov./ Pop.) • 1,500 persons per M.D. (POP. / Prov.) **What we use. 8
The Boundary Problem • Traditional measures (service capacitystandards) NOT very good: • Does NOT consider that people move among communities or political/data collection units to obtain medical services. • Nobody pays attention to what ZIP Code their doctor is in. • Does NOT consider distance (close or far). 9
The Theory • Spatial Interaction - The closer together phenomena are the easier it is for interaction to take place. • Spatial Interaction - Assumed to decline with increasing distance. • Distance Decay - The result of declining interaction - termed friction of distance. 11
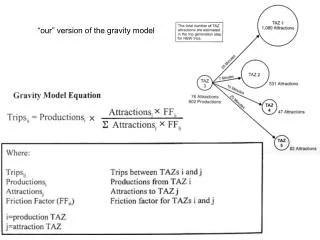
The Method (Spatial Analysis) • Gravity Models have been used in economics and social sciences since William Reily (Univ. of Texas) proposed the idea in 1929. • Gravity Models have been traditionally used in retail studies, but recently in health care. • Gravity Models allow for the measurement of spatial interaction as a function of distance. 12
Original (Retail) Gravity Model or Interaction between two areas i and j Population of each area Distance between areas Distance exponent - the higher the greater the friction of distance 13 ** Market area definition (polygons)
Applications • Still doing initial development and testing. • Preliminary survey data used to test gravity model. • Test maps for: • Hospital Beds • Primary Care Physicians • Registered Nurses • General Dentists 15
Applications • New data available shortly from licensing boards. • Demographic data being evaluated. • Risk factor (population segments at risk for receiving inadequate care) applications based on demographic data are being considered. 16
Future Directions • Use new data from licensing boards on a quarterly basis. • Enhance gravity model for demographic and risk factor analyses. • Train HPC staff to use the Excel and SAS based versions along with ArcView 3.x and Avenue scripts. • New version using ArcGIS (ArcMap) and ArcObjects (VB/A). 19
Future Directions • Address the “Edge Problem”: • Peripheral area data (Arizona, Colorado, Texas and Mexico ??) • Investigate using travel time instead of straight line distance (NM roads Arc/Info network coverage) • Review recent literature. • Prepare a presentation and publication. 20
Questions and Open Discussion Internal Web Page wwwdgr.unm.edu/hpc/hpc_grav.html MORE DETAIL - Up to date 21