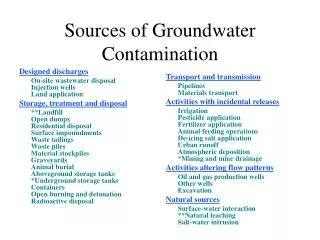
Download
1 / 17
170 likes | 311 Vues
Groundwater Arsenic Contamination in the United States. GIS Term Project, EWRE Fall 2000 By Hazim Tugun. Outline. Background Objectives Mapping of data/findings related to As in the groundwater Preliminary Conclusions Future work. Background. A gray brittle semi-metal

E N D
Groundwater Arsenic Contamination in the United States GIS Term Project, EWRE Fall 2000 By Hazim Tugun
Outline • Background • Objectives • Mapping of data/findings related to As in the groundwater • Preliminary Conclusions • Future work
Background • A gray brittle semi-metal • Naturally exists throughout the earth’s crust (often as Arsenic Sulfide, Metal Arsenates or Arsenites). • Has many oxidation states, As(III) or As(V).
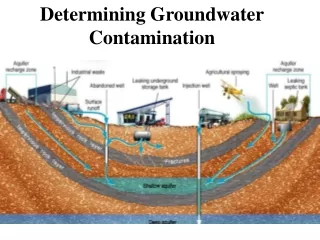
Background • Main sources: • Natural: From dissolution of naturally existing minerals/ores or soils, upflow of geothermal water. • Man-made: Industrial effluents, copper smelting, atmospheric deposition. • Adsorption-desorption, precipitation-dissolution with other environmental factors determine fate/transport in water.
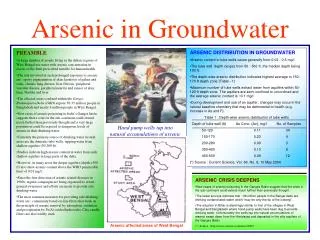
Background • Human exposure via food, water and air. • Regulated under EPA Drinking Water Standards: 50 ppb current limit 5 ppb proposed. • Acute or chronic health effects: • Skin lesions, skin, bladder, other internal cancers, upon prolonged exposures. • Poisoning / death can result upon ingestion of 60 ppm in drinking water.
Objectives • Create a map to show the geospatial distribution of groundwater Arsenic concentrations in the United States. • Use this distribution as a foundation to make general characterizations, if possible, of groundwater arsenic contamination with respect to: • Variations in the magnitude of contamination. • Possible sources of contamination. • Health effects.
GW As Mapping- Point Theme TAB-delimited ASCII text .dbf Event Theme
GW As Mapping- Interpolated Grid Showing hot spots above EPA current 50 ppb limit
Domestic, Public Supply and Recreational Uses of GW 40% of all the sampled GW
Public supply > 50 ppb 1.4% of the public supply GW is above current EPA limit
Health Effects- National Atlas Cancer Mortality Rate Data 50% of counties with GW supply > 50 ppb have the highest rates
Preliminary Conclusions • Western parts of the US seem to have higher GW As concentrations. • May be due to more natural sources than man-made sources. • Will become more clear when sources are looked at. • Exposure to As in GW from public supply > EPA limit is about 1.5%. Significant?
Preliminary Conclusions • Health data is not very helpful in seeing patterns. • Inadequate specific data in terms of the causes of cancer. Definitely needs further research / detailed epidemiological data. • Probably, other factors, such as simply smoking, wipes out the effects that may be observed just due to exposure to low levels of As in GW.
Future Work • Look at more health data. • Incorporate possible sources of As contamination in the GW of US. • Soils/Mineral Data from SSURGO. • EPA Toxic Release Information System.