Download
1 / 28
320 likes | 998 Vues
Mapping Groundwater Vulnerability to Contamination in Texas. Shannon Nicole Stokes GIS for Water Resources CE 394K.3 Term Project Presentation University of Texas at Austin November 19, 2001. Presentation Outline. Problem Development – Why do we need to model groundwater vulnerability?

E N D
Mapping Groundwater Vulnerability to Contamination in Texas Shannon Nicole Stokes GIS for Water Resources CE 394K.3 Term Project Presentation University of Texas at Austin November 19, 2001
Presentation Outline • Problem Development – Why do we need to model groundwater vulnerability? • Objectives • Specific Goals • DRASTIC • What is it? • Summary of each DRASTIC Parameters • Downfalls of DRASTIC • What’s left for me to do • Conclusions
Overall Objective To Adequately Protect Human Health, We Need to Ensure that Potential Contaminants Do not Enter the Public Water Supply
How Do We Do This?? • Protect Water Supply from Contamination • Remediate Contaminated Soils and Aquifers if spills do occur • Limited Financial Resources… If we cannot remediate every contaminated site immediately, which sites should we address first?
Specific Goals • Use GIS and DRASTIC to determine what PSWs are most vulnerable to contamination Specifically… • Use GIS, ACCESS and EXCEL files to get DRASTIC input parameters • In EXCEL calculate DRASTIC INDEXES for groundwater PWS • Show the DRASTIC INDEXES graphically in GIS
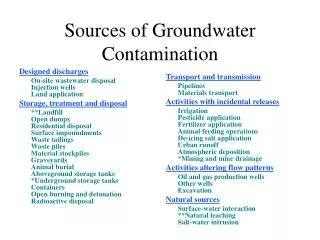
What is DRASTIC ?? • A method developed by the EPA to provide a systematic evaluation of the potential for groundwater contamination that is consistent on a national basis (Aller, L et. al. NWWA/EPA Series. 1987)
DRASTIC PARAMETERS • D- Depth to Water • R- Recharge • A- Aquifer Media • S- Soils • T- Topography • I- Impact of Vadose Zone • C- Hydraulic Conductivity
DRASTIC INDEX • Higher the Value, greater vulnerability Drastic Index = DrDw+RrRw+ArAw+SrSw+TrTw+IrIw+CrCw Where w = weight r = rank
Stacking of Drastic Layers to Produce a Vulnerability Map Stenson, M.P. & Stachotta, C.P., Queensland’s Groundwater Vulnerability Mapping Project. Queensland’s Department of Natural Resources.
Depth to Water • Depth to Water affects the Time available for a contaminant to undergo chemical and biological reactions (Dispersion, Oxidation, Natural Attenuation, Sorption, etc.) • Greater Depth Lower Vulnerability Rating
0-100 ft 100-300 ft 300-600 ft Greater than 600 ft
Net Recharge • Using data from Climate Rasters available from USGS Datasets • Apply a mass balance on the water Net Recharge = Precipitation – Evaporation – Runoff • Higher Recharge Greater vulnerability
Range Rating Thin or Absent 10 Gravel 10 Sand 9 Peat 8 Shrinking and/or Aggregated Clay 7 Sandy Loam 4 Loam 5 Silty Loam 4 Clay Loam 3 Muck 2 Nonshrinking and Nonaggregated Clay 1 Soil Media * Source: Aller et al., EPA, 1987.
Topography • Low Slope higher DRASTIC rating • Contaminant released is less likely to become run-off and therefore more likely to infiltrate to the aquifer • Slope data is available from DEM
Hydraulic Conductivity • Relates the factures, bedding planes and intergranular voids which become pathways for fluid movement • High Hydraulic Conductivity high movement once contaminant has entered aquifer high DRASTIC rating • Requires transmissivity (m2/day) and aquifer thickness (m)
Aquifer Media • Ratings are based on the permeability of each layer of media • High Permeability high DRASTIC rating • Some of this data is available in the well logs for the public water supplies. I have not determined how much more information I need yet.
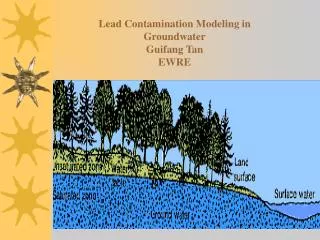
Impact of Vadose Zone • Zone below the typical soil horizon and above the water table • Unsaturated or discontinuously saturated • High Permeability of vadose zone high DRASTIC rating • Not clear where I can find this data. May have to make assumptions based on well log data.
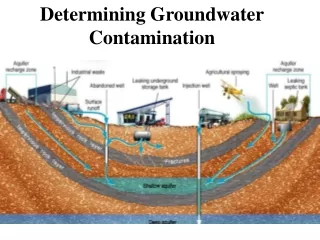
Major Assumptions of DRASTIC • Contaminant is introduced at ground surface • Contaminant is flushed into the groundwater by precipitation • Contaminant has the mobility of water
Next Steps • Finish collecting data for DRASTIC layers • Export DRASTIC parameter ratings to EXCEL to calculate DRASTIC Indexes • Prepare GIS map of DRASTIC Indexes • Overlay DRASTIC map with PWS to get a better understanding for what water supplies are vulnerable • Get everything done by Dec. 7!!
CONCLUSIONS • DRASTIC can be used to model groundwater vulnerability • Results of applying DRASTIC model must be used carefully. This applies a framework but does not account for all the particulars of the chemicals released. • A detailed study of a particular spill must incorporate the chemical properties of the contaminant • GIS can help make the results of a complicated model more clear through visual representation