Download
1 / 34
340 likes | 958 Vues
Overview of Presentation. IntroductionMethodologyAnticipated Results

E N D
1. DRASTIc Groundwater Vulnerability map of Tennessee James Bond � Capstone Proposal
2. Overview of Presentation Introduction
Methodology
Anticipated Results & Problems
References Introduction � Will state the goal of my project and give an introduction to DRASTIC
Methodology � Will provide a more detailed look at DRASTIC. Will discuss: method development, give examples of it�s application, provide a detailed look at the method itself. Will also discuss the general process I plan to follow for carrying out the project, including constraints and limitations that I will have.
Anticipated Results & Problems � will discuss what I hope to end up with, what problems I expect that I may encounter, and how my results can be improved upon.
References � A list of sources, primarily from the examples, but the important one is the EPA method document.Introduction � Will state the goal of my project and give an introduction to DRASTIC
Methodology � Will provide a more detailed look at DRASTIC. Will discuss: method development, give examples of it�s application, provide a detailed look at the method itself. Will also discuss the general process I plan to follow for carrying out the project, including constraints and limitations that I will have.
Anticipated Results & Problems � will discuss what I hope to end up with, what problems I expect that I may encounter, and how my results can be improved upon.
References � A list of sources, primarily from the examples, but the important one is the EPA method document.
3. INTRODUCTION
4. Introduction My Project
DRASTIC Groundwater Vulnerability Map of Tennessee
DRASTIC
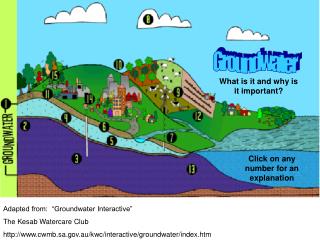
What is it?
Identifies areas where groundwater is susceptible to pollution
What are the applications?
Guides land development & resource protection
Flexible
Used at a variety of scales
Can be modified to include or exclude parameters The goal of my project is to produce a DRASTIC groundwater Vulnerability map of Tennessee. Internet research and conversation with TN Department of Env. Conservation (TDEC) has not revealed any instances where this has been done for TN.
DRASTIC
What is it? � Anyone who took GEOG 487 � Environmental Applications of GIS with Ken Corridini probably remembers DRASTIC. It is a method used to identify areas where the groundwater is more or less susceptible to impact from pollution.
What are the applications? � Used to guide land development and resource protection.
It can be used on a variety of scales, including sites (if they are large enough) such as the Savannah River Site in South Carolina, watersheds such as the Chippewa Creek watershed in OH, and states such as Pennsylvania.
It can be modified to include or exclude parameters such as nitrates and pesticides as in the study conducted on the Snake River Basin, ID. It can also serve as the basis for new methods as in the Florida Aquifer Vulnerability Assessment The goal of my project is to produce a DRASTIC groundwater Vulnerability map of Tennessee. Internet research and conversation with TN Department of Env. Conservation (TDEC) has not revealed any instances where this has been done for TN.
DRASTIC
What is it? � Anyone who took GEOG 487 � Environmental Applications of GIS with Ken Corridini probably remembers DRASTIC. It is a method used to identify areas where the groundwater is more or less susceptible to impact from pollution.
What are the applications? � Used to guide land development and resource protection.
It can be used on a variety of scales, including sites (if they are large enough) such as the Savannah River Site in South Carolina, watersheds such as the Chippewa Creek watershed in OH, and states such as Pennsylvania.
It can be modified to include or exclude parameters such as nitrates and pesticides as in the study conducted on the Snake River Basin, ID. It can also serve as the basis for new methods as in the Florida Aquifer Vulnerability Assessment
5. Here is an example of a DRASTIC Map. The lighter areas are more susceptible to contamination.Here is an example of a DRASTIC Map. The lighter areas are more susceptible to contamination.
6. METHODOLOGY
7. DRASTIC Overview DRASTIC � methodology guided by EPA
Developed by EPA & National Water Well Assoc.
600+ page guidance document
Link to Guidance:
http://nepis.epa.gov/Exe/ZyPURL.cgi?Dockey=20007KU4.txt
Purpose � Over large areas, used to identify regions where groundwater is more or less susceptible to impact from pollution. The DRASTIC method was developed by the EPA and the National Water Well Association. According to the EPA DRASTIC guidance document (EPA, 1987), DRASTIC is a qualitative method that is intended to be used over large areas as a way to begin to understand which areas are more or less likely to be impacted by contamination from the surface migrating into aquifers. The DRASTIC method was developed by the EPA and the National Water Well Association. According to the EPA DRASTIC guidance document (EPA, 1987), DRASTIC is a qualitative method that is intended to be used over large areas as a way to begin to understand which areas are more or less likely to be impacted by contamination from the surface migrating into aquifers.
8. DRASTIC Overview Cont. Overview of DRASTIC
Simplified GW vulnerability model
Qualitative
Produces a relative-risk scale
Applicable over large areas
Used as a screening tool
Results guide land development & resource protection
For small, specific sites, more detailed assessment needed
Simplified model � DRASTIC is a relatively simple model compared to many other vulnerability models. Requires relatively fewer data inputs
Qualitative � results are qualitative.
Qualitative results produce a �relative-risk� scale
Applicable to large areas
Screening tool
Results can guide general land development & resource protection decisions
For small areas, more detailed assessment is needed.
The DRASTIC method was developed by the EPA and the National Water Well Association as a way to produce a relative-risk scale of potential groundwater vulnerability to pollution that could be applied to a large area, while requiring relatively little data compared to other vulnerability models. According to the EPA DRASTIC guidance document (EPA, 1987), DRASTIC is a qualitative method that is intended to be used over large areas as a way to begin to understand which areas are more or less likely to be impacted by contamination from the surface migrating into aquifers. Due to the relative simplicity of DRASTIC compared to some other vulnerability assessment models, the large scale for which it is intended, and the qualitative nature of the results, DRASTIC should be thought of as a screening tool or as a �coarse-grained� look at aquifer vulnerability modeling that helps guide decisions and focus resources on areas that may require more detailed analyses, whether for land use decisions or environmental protection. Although DRASTIC is useful over large areas and serves as a good first step, ultimately, when making site-specific decisions on small, local areas, additional detailed site-specific hydrogeologic modeling of contamination potential would be considered as an appropriate next step.
9. DRASTIC Method Assumptions DRASTIC Makes Four Assumptions:
Contamination is introduced at the ground surface
Contamination is flushed into the groundwater by precipitation
Contamination has the mobility of water
Area being evaluated is 100-acres or larger
If these assumptions are not met, then DRASTIC is not the appropriate methodology In order for DRASTIC to be properly utilized and the results of the DRASTIC analysis to be fully understood, it is necessary to understand the assumptions that the method makes. The four key assumptions are:
�
Contamination is introduced at the ground surface
Contamination is flushed into the groundwater by precipitation
Contamination has the mobility of water
Area being evaluated is 100 acres or larger
�
It would be an inappropriate use of the DRASTIC methodology to apply it in situations where these four assumptions are not valid.
In order for DRASTIC to be properly utilized and the results of the DRASTIC analysis to be fully understood, it is necessary to understand the assumptions that the method makes. The four key assumptions are:
�
Contamination is introduced at the ground surface
Contamination is flushed into the groundwater by precipitation
Contamination has the mobility of water
Area being evaluated is 100 acres or larger
�
It would be an inappropriate use of the DRASTIC methodology to apply it in situations where these four assumptions are not valid.
10. DRASTIC Factors Seven hydrogeologic factors used. They form the acronym DRASTIC
D � Depth to Water
R � Net Recharge
A � Aquifer Media
S � Soil Media
T � Topography
I � Impact of Vadose Zone Media
C � Hydraulic Conductivity of Aquifer To develop the relative-risk index, DRASTIC utilizes the hydrogeologic factors that most significantly affect movement of contamination from the surface into an aquifer
�
The seven hydrogeologic factors, which form the acronym �DRASTIC� include:
�
D � Depth to Water
R � Net Recharge
A � Aquifer Media
S � Soil Media
T � Topography (slope)
I � Impact of Vadose Zone Media
C � Hydraulic Conductivity of aquifer
To develop the relative-risk index, DRASTIC utilizes the hydrogeologic factors that most significantly affect movement of contamination from the surface into an aquifer
�
The seven hydrogeologic factors, which form the acronym �DRASTIC� include:
�
D � Depth to Water
R � Net Recharge
A � Aquifer Media
S � Soil Media
T � Topography (slope)
I � Impact of Vadose Zone Media
C � Hydraulic Conductivity of aquifer
11. Weights & Ratings Significance of each factor in contaminant transport varies
Relative weight is assigned to each factor
Scale of 1 to 5
1 is least important factor
5 is most important factor
Each factor also has a rating applied according to a category or range of values. The importance of each factor in contaminant transport varies, therefore, each factor is assigned a relative weight on a scale of 1 to 5 (5 being the most significant). Further, each factor is divided into ranges or categories, to which is applied a rating. To develop the DRASTIC index for an area, the rating and weight of each factor are multiplied and the result for each factor is then added.
�
The importance of each factor in contaminant transport varies, therefore, each factor is assigned a relative weight on a scale of 1 to 5 (5 being the most significant). Further, each factor is divided into ranges or categories, to which is applied a rating. To develop the DRASTIC index for an area, the rating and weight of each factor are multiplied and the result for each factor is then added.
�
12. DRASTIC � The Equation Once ratings and weights have been applied, they are multiplied and added
DRASTIC equation:
DrDw + RrRw + ArAw + SrSw + TrTw + IrIw + CrCw = Pollution Potential
r = rating
w = weight
Results are symbolized on a map overlaying study area
Once the analysis has been completed � ratings and weights assigned to each factor and the results summed � the resulting relative-risk index can then be symbolized on a map overlaying the study area, providing a qualitative analysis of the vulnerability to pollution.
Once the analysis has been completed � ratings and weights assigned to each factor and the results summed � the resulting relative-risk index can then be symbolized on a map overlaying the study area, providing a qualitative analysis of the vulnerability to pollution.
13. Methodology - Example Example of how ratings and weights are applied
Will use D Factor (Depth to Water) as example
D receives a weight of 5
It is very significant in potential impact to GW
Based on actual depth to groundwater, D also receives a rating.
As an example of the application of the ratings and weights, consider factor D - Depth to Water. Following the guidelines established in the methodology, the D factor, being important in contaminant movement, receives a weight of 5. However, we also have to consider the actual depth to water. As an example of the application of the ratings and weights, consider factor D - Depth to Water. Following the guidelines established in the methodology, the D factor, being important in contaminant movement, receives a weight of 5. However, we also have to consider the actual depth to water.
14. Methodology � Example Cont. If depth to water was 10 ft then D rating would be 9
DrDw = 9 x 5 = 45
If depth to water was 100 ft, then D rating would be 2
DrDw = 2 x 5 = 10
This process is repeated for each of the factors
If the depth to water was 10 feet, then in addition to a weight of 5, D would also receive a rating of 9, producing a combined value of 5 x 9 = 45. If the depth to water was 100 feet, then D would only receive a rating of 2, which would produce a combined value of 5 x 2 = 10. So, the actual values for each factor, such as depth to water, really plays a huge role in the DRASTIC scores. If the depth to water was 10 feet, then in addition to a weight of 5, D would also receive a rating of 9, producing a combined value of 5 x 9 = 45. If the depth to water was 100 feet, then D would only receive a rating of 2, which would produce a combined value of 5 x 2 = 10. So, the actual values for each factor, such as depth to water, really plays a huge role in the DRASTIC scores.
15. What follows is an example (from my project in GEOG 487) that will give a feel for how the overlay works � how the inputs are combined to arrive at the final DRASTIC index. There won�t be much to say about these slides. I intend to move through them quickly � only a few seconds per slide.
elevationWhat follows is an example (from my project in GEOG 487) that will give a feel for how the overlay works � how the inputs are combined to arrive at the final DRASTIC index. There won�t be much to say about these slides. I intend to move through them quickly � only a few seconds per slide.
elevation
16. geologygeology
17. soilsoil
18. Land useLand use
19. GW depth rangesGW depth ranges
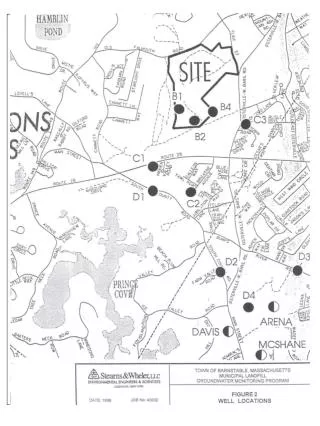
20. Wells.
Wells.
21. This slide just highlights that there are a lot of intermediate steps involved in this analysis. This slide just highlights that there are a lot of intermediate steps involved in this analysis.
22. This is the resulting map. The lighter areas are more susceptible to contamination.This is the resulting map. The lighter areas are more susceptible to contamination.
23. Capstone Process To successfully develop the proposed DRASTIC model and complete the capstone project, it will be necessary to develop and follow an overall capstone process, as well as a process specific to the data analysis. The general approach to completing the Capstone project will include the following steps:
Review of DRASTIC methodology � this will establish the fundamental methodology for the project
Identify data needed � required data will be identified in the DRASTIC methodology guidance
Gather data � mine data from public sources
Identify Data Gaps � this includes data inputs that could not be located in a GIS format
Fill Data Gaps or revise methodology � will need to either infer the missing inputs from other available data or will need to revise the methodology, if possible, to exclude the missing inputs.
Perform analysis resulting in relative risk index
Create Map
Present Results, including problems encountered and suggestions for model refinement
To successfully develop the proposed DRASTIC model and complete the capstone project, it will be necessary to develop and follow an overall capstone process, as well as a process specific to the data analysis. The general approach to completing the Capstone project will include the following steps:
Review of DRASTIC methodology � this will establish the fundamental methodology for the project
Identify data needed � required data will be identified in the DRASTIC methodology guidance
Gather data � mine data from public sources
Identify Data Gaps � this includes data inputs that could not be located in a GIS format
Fill Data Gaps or revise methodology � will need to either infer the missing inputs from other available data or will need to revise the methodology, if possible, to exclude the missing inputs.
Perform analysis resulting in relative risk index
Create Map
Present Results, including problems encountered and suggestions for model refinement
24. Data Analysis Process An generalized overview of the approach to performing the analyses for the project
Generalize data where appropriate - for example if there a dozen types of clay represented in the soils data, then it may be appropriate to generalize to a single type for this model
An generalized overview of the approach to performing the analyses for the project
Generalize data where appropriate - for example if there a dozen types of clay represented in the soils data, then it may be appropriate to generalize to a single type for this model
25. Self-Imposed Project Parameters Due to time constraints, need to impose parameters on the analysis
Use unmodified version of method
Use existing datasets as much as possible
To fill datagaps will use the easier of two approaches:
Derive missing data from other existing data
Use generalized values in EPA guidance Because a project like this could go on for a long long time if you wanted it to, what with searching for better and better data, re-running the analysis, refining the model, and on and on, I felt it was necessary to impose to limitation on myself at the beginning.
The primary time constraint is that I want to finish and graduate.
I will use unmodified version
I will use existing datasets wherever possible regardless of scale or resolution.
Will fill data gaps be the easiest method.
In order to successfully complete a DRASTIC analysis of the state within the time constraints of the capstone project, I plan to use the standard, unmodified version of the method as outlined in the EPA guidance. In other words, I will not be adding factors such as pesticides or nitrates. In addition, it will be necessary to utilize existing input data as much as possible even though available data may be of low resolution or small scale. In cases where the required data do not exist, it will be necessary to either infer the input data from other available data or to use the generalized inputs provided in the DRASTIC guidance document. When filling data gaps, where possible, the generalized inputs from the EPA guidance document will be used.
Because a project like this could go on for a long long time if you wanted it to, what with searching for better and better data, re-running the analysis, refining the model, and on and on, I felt it was necessary to impose to limitation on myself at the beginning.
The primary time constraint is that I want to finish and graduate.
I will use unmodified version
I will use existing datasets wherever possible regardless of scale or resolution.
Will fill data gaps be the easiest method.
In order to successfully complete a DRASTIC analysis of the state within the time constraints of the capstone project, I plan to use the standard, unmodified version of the method as outlined in the EPA guidance. In other words, I will not be adding factors such as pesticides or nitrates. In addition, it will be necessary to utilize existing input data as much as possible even though available data may be of low resolution or small scale. In cases where the required data do not exist, it will be necessary to either infer the input data from other available data or to use the generalized inputs provided in the DRASTIC guidance document. When filling data gaps, where possible, the generalized inputs from the EPA guidance document will be used.
26. ANTICIPATED RESULTS & PROBLEMS
27. Anticipated Results State of TN groundwater vulnerability map
Detailed report of methodology and data used
Map will be technically correct
Considered FINAL within context of capstone project
Considered DRAFT by public and professionals who may use it
At the end of the project, I anticipate that I will have developed a basic groundwater vulnerability map of the state of Tennessee, along with a detailed report of the methodology and data used. I expect that the resulting DRASTIC relative-risk index will be technically correct from the standpoint that the DRASTIC methodology was followed and the spatial analyses were performed correctly. Although I expect the groundwater vulnerability map produced from this project to be technically correct, I also believe that it should be considered to be a DRAFT map by the public and professionals who might use it.
At the end of the project, I anticipate that I will have developed a basic groundwater vulnerability map of the state of Tennessee, along with a detailed report of the methodology and data used. I expect that the resulting DRASTIC relative-risk index will be technically correct from the standpoint that the DRASTIC methodology was followed and the spatial analyses were performed correctly. Although I expect the groundwater vulnerability map produced from this project to be technically correct, I also believe that it should be considered to be a DRAFT map by the public and professionals who might use it.
28. Anticipated Problems Low Resolution Data
Anticipate using only small scale data
Missing data
Not all inputs may be available
May have to infer data or use generalized inputs
Room for improvement
Analysis can be easily re-run with better data
Better data = better results
Additional refinement outside the scope of this capstone project So, why do I think my map should be considered a �draft� and have room for improvement?
Low Resolution Data: This will be due to the fact that for this project I anticipate only the use of small-scale datasets (1:250,000). The incorporation of more detailed (larger-scale) localized data into the analysis would improve the results.
Missing Data: In addition, it may be necessary to fill data gaps by either inferring the missing data from other existing data, or by using the generalized values provided in the methodology guidance. Both methods may introduce inaccuracy into the data.
Room for Improvement: Because of low res data and missing data/filling data gaps, the model developed by this project will have room for refinement. The incorporation of more detailed (larger-scale) localized and more accurate data into the analysis would result in a more accurate map of the relative-risk index. In other words, the relative-risk index that results from this project should be considered a first step in developing an accurate and useful groundwater vulnerability model of Tennessee, rather than a definitive final step.
So, why do I think my map should be considered a �draft� and have room for improvement?
Low Resolution Data: This will be due to the fact that for this project I anticipate only the use of small-scale datasets (1:250,000). The incorporation of more detailed (larger-scale) localized data into the analysis would improve the results.
Missing Data: In addition, it may be necessary to fill data gaps by either inferring the missing data from other existing data, or by using the generalized values provided in the methodology guidance. Both methods may introduce inaccuracy into the data.
Room for Improvement: Because of low res data and missing data/filling data gaps, the model developed by this project will have room for refinement. The incorporation of more detailed (larger-scale) localized and more accurate data into the analysis would result in a more accurate map of the relative-risk index. In other words, the relative-risk index that results from this project should be considered a first step in developing an accurate and useful groundwater vulnerability model of Tennessee, rather than a definitive final step.
29. Summary
30. Summary Project to produce groundwater vulnerability map of Tennessee
Has not been done for Tennessee
Use EPA DRASTIC vulnerability methodology
Use small scale, publicly available data
Result will be a first cut at groundwater vulnerability mapping
Model will have room for refinement
Outside the scope of this project
31. Q&A Questions?
32. Thank you
33. REFERENCES
34. References U.S. EPA DRASTIC Guidance Document
United States Environmental Protection Agency (EPA), 1987, DRASTIC: A Standardized System for Evaluating Ground Water Pollution Using Hydrogeologic Settings, EPA/600/2-87-035, Robert S. Kerr Environmental Research Laboratory, Ada, OK 74820
Examples of the Application of DRASTIC
Arthur, Jonathan D., et al., 2005, Florida Aquifer Vulnerability Assessment (FAVA): Contamination Potential of Florida�s Principal Aquifer Systems, Division of Resource Assessment and Management, Florida Geological Survey
Chowdhury, Shafiul, et al, 2003, Comprehensive approach of groundwater resource evaluation: a case study in the Chippewa Creek watershed in Ohio, The Ohio Journal of Science, December 2003
Crider, S.S., 1989, A Cursory Application of DRASTIC to the Savannah River Site, WSRC-RP-89-744, DE92 009778, Division of Engineering Fundamentals, Virginia Polytechnic Institute and State University, Blacksburgh, VA 24061-0218
�Evans, Barry, et al, 1990, A GIS-Based Approach to Evaluating Regional Groundwater Pollution Potential with DRASTIC, Journal of Soil and Water Conservation, March-April, pp. 242-245
Rupert, Michael G., 1999, Improvements to the DRASTIC Ground-Water Vulnerability Mapping Method, USGS Fact Sheet FS-066-99, Department of the Interior, US Geological Survey, Denver, CO 80225