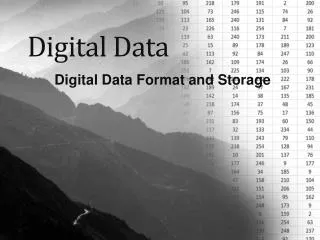
Digital Data
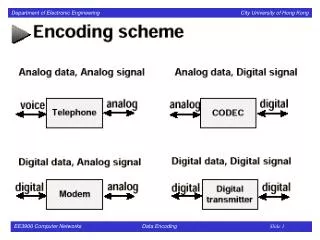
Digital Data. Digital Data Format and Storage. Learning Objectives. What are spatial data models and how do they differ? What data model commonly used for remotely sensed data and why? What are digital numbers (and what aren’t they!)?

Digital Data
E N D
Presentation Transcript
Digital Data Digital Data Format and Storage
Learning Objectives • What are spatial data models and how do they differ? • What data model commonly used for remotely sensed data and why? • What are digital numbers (and what aren’t they!)? • How do you translate DNs to units of light, or to reflectance? • Why should you be cautious about altering the original DNs in an image? • What are image bands? • How do we store image data on computers? • What are histograms, and what are some ways they are used? • What is contrast stretching?
Spatial Data Models • What do we mean by a “spatial data model”? • What are the two main data models used to depict spatial data on computers (e.g., in GIS and remote sensing)
Remotely Sensed Data • Represent the amount of light reflecting off the ground and reaching the satellite sensor. • Continuous change from place to place, or not? • Often cover large areas (lots of data!) • Multiple images (bands) are collected simultaneously for each place in an image • What data model might be best for this image?
Picture Elements • What is the common abbreviation for picture elements? • What shapes can be used? • What shape is most common?
Raster Data • Imaginary matrix (row & column format) is placed on the feature (e.g., the ground) • Some phenomenon (e.g. amount of reflected light) is measured • A value (called a digital number or DN) representing the strength of the signal (amount of light) is assigned to each grid cell (pixel).
32 47 67 93 11 105 79 136 155 35 23 55 213 179 203 163 63 11 145 245 89 211 189 56 201 43 202 21 122 109 Assign DNs to pixels
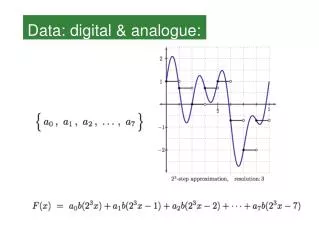
How are DNs assigned? • In remote sensing, the amount of light coming from a pixel depends (in part) on how much light reflects off the various materials that fall within the pixel area on the ground. • Functionally, it is an average of the light reflecting from the various components. • But, it isnot reflectance!Why not? • What do you have to do to convert DNs to reflectance?? • Depending on the intensity of the light, a numeric DN is assigned to each pixel • Low or None - Lowest DN (0 is at bottom of scale) • High - Maximum value (depends on radiometric resolution) • Others - Scaled in between (number of possible increments depends on radiometric resolution)
How do we keep track of pixel locations? • Images are presented as 2-d arrays (matrices). Each pixel has a location (x,y) in the array. • Position of pixel often described in terms of image rows and columns (called image coordinates) or map coordinates (e.g. latitude/longitude). F(2,3) F(4,1)
Image Bands • You can think of image bands (also called channels and sometimes layers) as a collection of pictures taken simultaneously of the same place, each of which measures reflected light from a different part of the spectrum. • Together, image bands allow us to create spectral curves for each pixel.
blue red green UV Near-infrared 0.4 0.5 0.6 0.7 Image Bands (or channels)
How are images stored? • Many proprietary image file formats • Typically include 1) a header and 2) the image data themselves • Image data can be organized in several ways • Band Sequential (BSQ) • Band Interleaved by Line (BIL) • Band Interleaved by Pixel (BIP)
1 2 3 1 1 2 2 3 3 1 2 3 1 3 2 2 1 3 1 3 2 2 1 3 3 1 2 Example Band 1 Band 2 Band 3 3 bands, 9 pixels each
1 1 1 1 1 1 1 1 1 2 2 2 2 2 2 2 2 2 3 3 3 3 3 3 3 3 3 2 1 3 1 3 2 1 3 2 3 1 2 3 2 1 2 3 1 3 1 2 3 2 1 1 2 3 Case 1 • Band sequential (BSQ) format • Band #1 is stored first • Followed by #2, #3 • Bands are stored sequentially
1 1 1 2 2 2 3 3 3 1 1 1 2 2 2 3 3 3 1 1 1 2 2 2 3 3 3 2 1 3 1 3 2 1 3 2 3 1 2 3 2 1 2 3 1 3 1 2 3 2 1 1 2 3 Case 2 • BIL format • Line #1, band #1 is stored first • Followed by line #1, band #2 • Bands are inter-leaved by line
1 2 3 1 2 3 1 2 3 1 2 3 1 2 3 1 2 3 1 2 3 1 2 3 1 2 3 2 1 3 1 3 2 1 3 2 3 1 2 3 2 1 2 3 1 3 1 2 3 2 1 1 2 3 Case 3 • BIP format • Pixel #1, Line #1, band #1 is stored first • Followed by Pixel #1, line #1, band #2 • Bands are inter-leaved by PIXEL
Histograms • A histogram is a graph showing the number of pixels in a single band corresponding to each possible DN. • We can use information in histograms for contrast stretching, atmospheric correction, statistical manipulations, and many other applications.
Contrast Stretching • Computer monitors have a range of brightness that they use to display images. • Unprocessed remotely sensed images often don’t use the full range. • Contrast stretching changes (sometimes just temporarily) the DNs to take advantage of the full range. • Usually best not to permanently change the DNs. Why?
High Contrast Low Contrast
Types of Contrast Stretches • Contrast stretches can be linear (DNs stretched evenly across the available range of values) • …or they can be nonlinear (some DNs changed more than others) • Within each of these are many different stretching algorithms. • Which you choose depends on what you are trying to see in an image. • Erdas and other image display software often applies a temporary contrast stretch automatically to make images looks crisp.
Before Contrast Stretch After Linear Stretch
Understanding the structure of images is crucial to understanding how to manipulate imagery to extract information.