Analysis of Healthcare Discharge Trends and Influencing Factors from 2009 to 2010
This report examines variations in healthcare discharges from 2009 to 2010, focusing on Diagnosis-Related Groups (DRGs) and average lengths of stay (MLOS). It highlights significant changes in specific procedures like chemotherapy, skin disorders, and urinary tract diagnoses, including their impact on discharge rates and healthcare facilities. Key factors influencing patient health and treatment outcomes are also discussed, providing insights into healthcare trends and patient management over the two-year period.

Analysis of Healthcare Discharge Trends and Influencing Factors from 2009 to 2010
E N D
Presentation Transcript
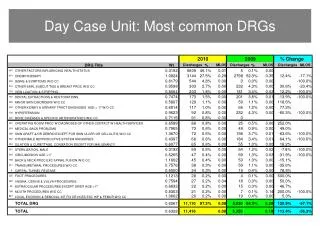
2010 2009 % Change DRG Title Wt Discharges % MLOS Discharges % MLOS Discharges MLOS 0.3192 5609 49.1% 0.01 5 0.1% 0.00 OTHER FACTORS INFLUENCING HEALTH STATUS 467 1.0824 3144 27.5% 0.29 2798 52.3% 0.35 12.4% -17.1% CHEMOTHERAPY 410 0.6179 544 4.8% 0.00 0 0.0% 0.00 -100.0% SIGNS & SYMPTOMS W/O CC 464 0.9598 303 2.7% 0.00 232 4.3% 0.00 30.6% -23.4% OTHER SKIN, SUBCUT TISS & BREAST PROC W/O CC 270 0.8064 203 1.8% 0.00 181 3.4% 0.02 12.2% -100.0% VEIN LIGATION & STRIPPING 119 0.7474 173 1.5% 0.00 201 3.8% 0.01 -13.9% -100.0% DENTAL EXTRACTIONS & RESTORATIONS 187 0.5807 129 1.1% 0.00 59 1.1% 0.00 118.6% MINOR SKIN DISORDERS W/O CC 284 0.6914 117 1.0% 0.00 66 1.2% 0.00 77.3% OTHER KIDNEY & URINARY TRACT DIAGNOSES AGE > 17 W/O CC 332 0.9623 92 0.8% 0.00 232 4.3% 0.00 -60.3% -100.0% HYPERTENSION 134 0.7115 91 0.8% 0.00 0 BONE DISEASES & SPECIFIC ARTHROPATHIES W/O CC 245 0.6589 88 0.8% 0.00 25 0.5% 0.00 252.0% OPERATING ROOM PROC W DIAGNOSES OF OTHER CONTACT W HEALTH SERVICES 461 0.7965 73 0.6% 0.00 49 0.9% 0.00 49.0% MEDICAL BACK PROBLEMS 243 1.3670 72 0.6% 0.00 198 3.7% 0.01 -63.6% -100.0% SKIN GRAFT &/OR DEBRID EXCEPT FOR SKIN ULCER OR CELLULITIS W/O CC 266 0.4397 66 0.6% 0.00 184 3.4% 0.01 -64.1% -100.0% OTHER MALE REPRODUCTIVE SYSTEM DIAGNOSES 352 0.6077 65 0.6% 0.00 55 1.0% 0.00 18.2% DILATION & CURETTAGE, CONIZATION EXCEPT FOR MALIGNANCY 364 0.3192 59 0.5% 0.00 64 1.2% 0.02 -7.8% -100.0% STERILIZATION, MALE 351 0.6265 47 0.4% 0.00 69 1.3% 0.03 -31.9% -100.0% CIRCUMCISION AGE >17 342 1.1662 45 0.4% 0.00 53 1.0% 0.00 -15.1% BACK & NECK PROC EXC SPINAL FUSION W/O CC 758 0.7576 38 0.3% 0.00 59 1.1% 0.00 -35.6% TRANSURETHRAL PROCEDURES W/O CC 311 0.6500 34 0.3% 0.00 19 0.4% 0.00 78.9% CARPAL TUNNEL RELEASE 6 1.1213 28 0.2% 0.00 4 0.1% 0.00 600.0% FOOT PROCEDURES 225 0.7594 27 0.2% 0.04 18 0.3% 0.00 50.0% 360 VAGINA, CERVIX & VULVA PROCEDURES 0.6833 22 0.2% 0.00 15 0.3% 0.00 46.7% EXTRAOCULAR PROCEDURES EXCEPT ORBIT AGE >17 40 0.8303 21 0.2% 0.00 7 0.1% 0.14 200.0% -100.0% MOUTH PROCEDURES W/O CC 169 1.0662 20 0.2% 0.00 19 0.4% 0.00 5.3% 867 LOCAL EXCISION & REMOVAL INT FIX DEVICES EXC HIP & FEMUR W/O CC TOTAL DRG 11,110 97.3% 0.09 5,030 94.0% 0.20 120.9% -57.1% 0.6267 TOTAL 11,416 0.08 5,350 0.19 113.4% -56.3% 0.6328 Day Case Unit: Most common DRGs