Organizing Data
Organizing Data. Frequency distribution. Organizes raw data in table form Uses classes and frequencies. Raw Data.


Organizing Data
E N D
Presentation Transcript
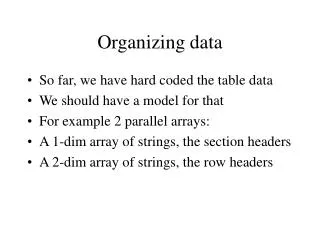
Frequency distribution • Organizes raw data in table form • Uses classes and frequencies
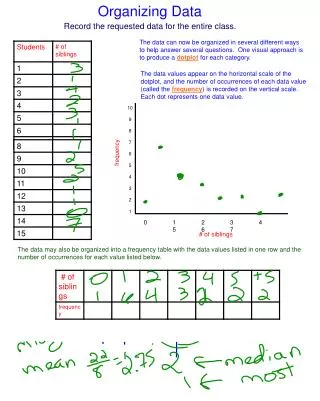
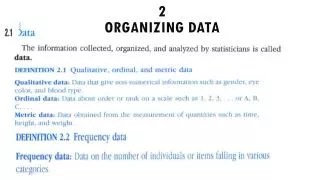
Raw Data • Raw data is data collected in its original form. Common examples of raw data are census data, prior to its being analyzed. Data may represent almost anything. The distance you live from school is a form of data.
Types of Frequency Distributions • Categorical (ie blood type) • Ungrouped (ie the number of cups of coffee drunk at breakfast). This type of data would not be broken down into groups. • Grouped (ie Ages of members of Congress)
Continuous Distribution • Class Limits: Same decimal place as the data • Class Boundaries: One additional decimal place as the data, with the last digit being 5 • Class Width: Subtract the upper class limit from one class from the upper limit of the next highest class
Classes • Should have 5 - 20 (guide only) • Should have odd width, so can graph midpoint (guide only). Width: The difference between the upper limit of one class and the upper limit of the next class. • Should be same width (exceptions: first or last class) • Must be mutually exclusive • Must be continuous • Must be exhaustive (must include all data) • P 43 # 5 oral
Constructing a grouped frequency distribution • Find highest and lowest value • Find the range • Select the number of classes desired. Note: This information will be provided. • Find the width by dividing the number of classes and rounding up. • Select a starting point, which is either the lowest value or a logical number less than the lowest point; add the width to get the lower limits of the classes. • Find the upper class limits • Find the boundaries
Percentages were calculated as part of the frequency distribution as they are used in certain types of graphs, such as pie graphs