Organizing Data
Organizing Data. AP Stats Chapters 2-4. Organizing Data. Categorical Dotplot (also used for quantitative) Bar graph Pie chart Quantitative Stemplots Unreasonable with large data sets Histogram Frequency/relative frequency. Describing Distributions. Remember “SECS-C” S – Shape


Organizing Data
E N D
Presentation Transcript
Organizing Data AP Stats Chapters 2-4
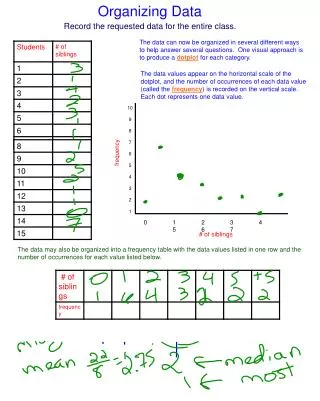
Organizing Data • Categorical • Dotplot (also used for quantitative) • Bar graph • Pie chart • Quantitative • Stemplots • Unreasonable with large data sets • Histogram • Frequency/relative frequency
Describing Distributions • Remember “SECS-C” • S – Shape • E – Extreme Values (outliers) • C – Center • S – Spread • C – Context • **Make meaningful descriptions and comparisons. Don’t just list numbers.**
Shape • Symmetric • Values smaller and larger than the midpoint are mirror images. • Skewed • The tail on one end is much longer than the other tail.
Ways to Measure Center • Mean • The mean is not a resistant measure of center. (sensitive to outliers) • Used mostly with symmetric distributions.
Ways to measure center • Median • Midpoint of a distribution • Median is a resistant measure of center • Used with symmetric or skewed distributions.
Ways to Measure Spread • 1) Range • Highest value – lowest value • Problem: could be based on outliers • 2) Quartiles (for use with median) • pth percentile – value such that p percent of the observations fall at or below it • Q1 (quartile 1): 25th percentile • Median of the first half of the data • Q3 (quartile 3): 75th percentile • Median of the second half of the data
Ways to Measure Spread • 5 Number Summary • Minimum, Q1, median, Q3, maximum • The 5-number summary for a distribution can be illustrated in a boxplot.
1.5 x IQR Rule for Outliers • IQR = Q3 – Q1 (Interquartile Range) • Rule: If an observation falls more than 1.5 x IQR above Q3 or below Q1, then we consider it an outlier. • The 5 Number Summary can be used for distributions which are skewed, or which have strong outliers.
Ways to Measure Spread • Standard deviation (for use with the mean) • Std Dev tells you, on average, how far each observation is from the mean.
Properties of Standard Deviation • s gets larger as the data become more spread out. • Only use mean and std dev for reasonably symmetric distributions which are free of outliers.
Linear Transformation of Data • Xnew = a + bx • The shape of the distribution does not change. • Multiplying each observation by a positive number, b, multiplies both measures of center and measures of spread by b. • Adding the same number, a, to each observation adds a to measures of center and to quartiles, but does not change measures of spread.