Organizing Data
Organizing Data. Section 2.1. Organize Qualitative Data. A frequency distribution lists each category of data and the number of occurrences for each category of data. Let use an example and build a Frequency Table. Relative frequency.


Organizing Data
E N D
Presentation Transcript
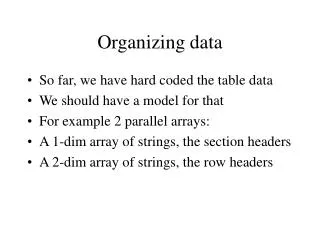
Organizing Data Section 2.1
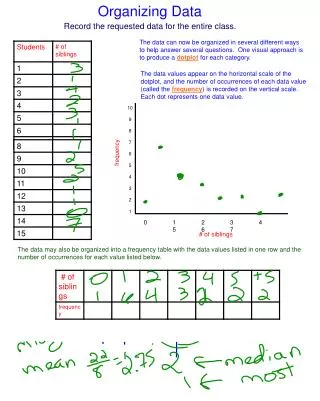
Organize Qualitative Data • A frequency distribution lists each category of data and the number of occurrences for each category of data. • Let use an example and build a Frequency Table.
Relative frequency • The relative frequency is the proportion (or percent) of observations within a category and is found using the formula: • A relative frequency distribution lists the relative frequency of each category of data.
Our Example • Determine the relative frequency distribution for our example • Use these to make a table of relative frequencies
Bar graphs • A bar graph is constructed by labeling each category of data on either the horizontal or vertical axis and the frequency or relative frequency of the category on the other axis • Frequency or Relative Frequency
Pie Chart The following data represent the marital status (in millions) of U.S. residents 18 years of age or older in 2006. Draw a pie chart of the data.
Marital Status in 1990 vs. 2006 1990 2006 Relative Frequency Marital Status
Quantitative Data The following data represent the number of available cars in a household based on a random sample of 50 households. Construct a frequency and relative frequency distribution. 3 0 1 2 1 1 1 2 0 2 4 2 2 2 1 2 2 0 2 4 1 1 3 2 4 1 2 1 2 2 3 3 2 1 2 2 0 3 2 2 2 3 2 1 2 2 1 1 3 5