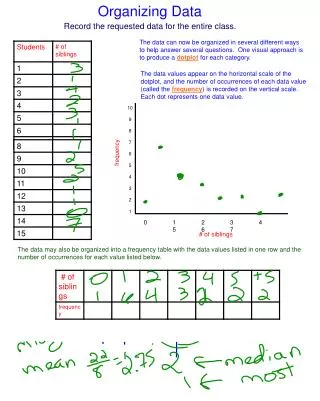
Organizing data
Learn about different types of graphs - line, bar, and pie charts - their purposes, characteristics, and when to use each for optimal data representation. Explore how to organize and interpret data effectively. Gain insights to create impactful visualizations.


Organizing data
E N D
Presentation Transcript
Organizing data Chapter 1.3
3 main kinds of graphs • Line graphs • Bar graphs • Pie charts
Line graphs • displays data that changes • Data that is continuous • X-axis shows the independent variable • Y-axis shows the dependent variable • Can compare data sets
Scatter plot Use scatter plots when the dots are too spread out to properly show the trend if all of the dots are connected. More information on scatter plots
Bar Graphs • Compares similar data for many individual items or events • Clearly demonstrates differences
Pie Charts • Shows parts of a whole
Pie charts • Species of Jalpan, Querétaro, MÉXICO
I'm too sexy by right said Fred I:\General Stuff
Steps in graphing • Label graph; title should state exactly what can be found in the graph • Determine which variables go on the x-axis and y-axis *The independent variable should be on the x-axis • Label axes (including units) • Determine the appropriate distance of units on the axes
5. Plot the data 6. Make interpretations of the trends.