Download
1 / 3
30 likes | 195 Vues
A. Empty vector. LepRb. Empty vector. LepRb. Leptin: - - - + + + - - - + + +. Leptin: - - - + + + - - - + + +. pSTAT3 (Y705). STAT3. 5 minutes of treatment. 15 minutes of treatment. 0.2. 0.18. pcDNA3-Co. 0.16.

E N D
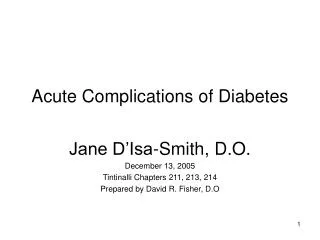
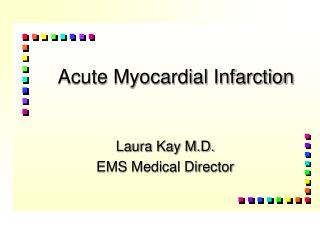
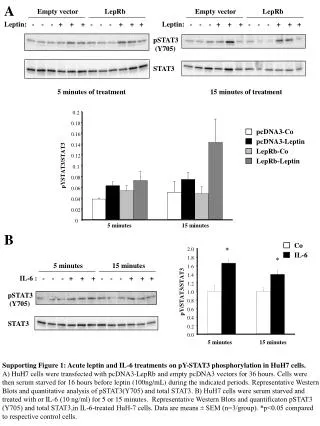
A Empty vector LepRb Empty vector LepRb Leptin: - - - + + + - - - + + + Leptin: - - - + + + - - - + + + pSTAT3 (Y705) STAT3 5 minutes of treatment 15 minutes of treatment 0.2 0.18 pcDNA3-Co 0.16 pcDNA3-Leptin 0.14 LepRb-Co 0.12 LepRb-Leptin pYSTAT3/STAT3 0.1 0.08 0.06 0.04 0.02 0 5 minutes 15 minutes B Co * 2.0 IL-6 * 1.8 5 minutes 15 minutes 1.6 IL-6 : - - - + + + - - - + + + 1.4 1.2 pY/STAT3/STAT3 pSTAT3 (Y705) 1.0 0.8 0.6 0.4 STAT3 0.2 0.0 5 minutes 15 minutes Supporting Figure 1: Acute leptin and IL-6 treatments on pY-STAT3 phosphorylation in HuH7 cells. A) HuH7 cells were transfected with pcDNA3-LepRb and empty pcDNA3 vectors for 36 hours. Cells were then serum starved for 16 hours before leptin (100ng/mL) during the indicated periods. Representative Western Blots and quantitative analysis of pSTAT3(Y705) and total STAT3. B) HuH7 cells were serum starved and treated with or IL-6 (10 ng/ml) for 5 or 15 minutes. Representative Western Blots and quantificaton pSTAT3 (Y705) and total STAT3,in IL-6-treated HuH-7 cells. Data are means ± SEM (n=3/group). *p<0.05 compared to respective control cells.
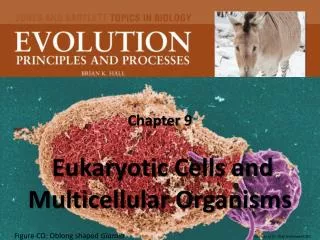
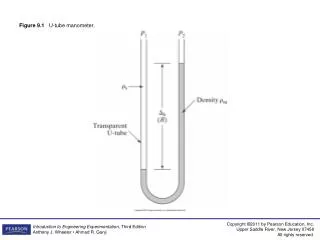
Ad-GFP Ad-FTO * 8 7 6 5 FTO/TBP mRNA (a.u) 4 3 2 1 0 epAT Liver Hypothalamus Supporting Figure 2: Validation of the specific overexpression of FTO in liver of infected mice. Mice were infected with adenovirus encoding either FTO or GFP (as control), by reorbital injections, for 10 days. FTO mRNA levels were measured by real-time RT-PCR and normalized by TBP, in liver, epididymal adipose tissue (epAT) and hypothlamus of infected mice. FTO was overexpressed specifically in liver of infected mice.
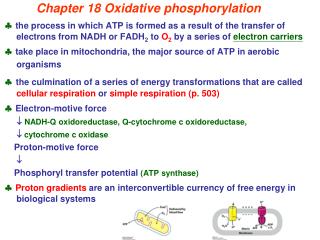
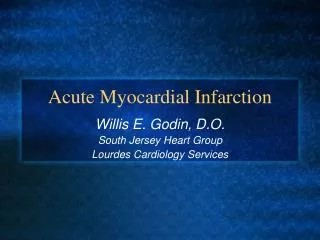
A 1.4 1.2 1.0 pY-STAT3/STAT3 0.8 0.6 0.4 0.2 0.0 Co Leptin * Co Leptin pSTAT3 (Y705) STAT3 B 0.18 0.16 * 0.14 0.12 0.10 G6P/TBP mRNA levels 0.08 0.06 0.04 0.02 0.00 Co Leptin Supporting Figure 3: Effect of leptin on pY-STAT3 phosphorylation and G6P expression in rat primary hepatocytes. Primary hepatocytes were isolated from rat liver andtreated for 3 hours with leptin(100ng/mL). A) Representative Western Blots and quantitative analysis of pSTAT3(Y705) and total STAT3, in rat primary hepatocytes treated or not with leptin. B) mRNA levels of G6P in rat primary hepatocytes treated or not with leptin. Data are means ± SEM (n=3/group). *p<0.05 compared to untreated hepatocytes.