Download
1 / 22
230 likes | 469 Vues
CO 2 sequestration in geological formations – application of Computer Tomography (CT). Outline. Background of CO 2 sequestration Core idea – new research Fundamentals of Computer Tomography (CT) Experimental Setup and Measurements Results Future Work. CO 2 sequestration.

E N D
CO2 sequestration in geological formations – application of Computer Tomography (CT)
Outline • Background of CO2 sequestration • Core idea – new research • Fundamentals of Computer Tomography (CT) • Experimental Setup and Measurements • Results • Future Work
CO2 sequestration • The carbon dioxide (CO2) concentration in Earth’s atmosphere is continuously and strongly increasing (Mauna Kea Observatories). • CO2 increases the average global temperature. This again leads to climate change (Orr 2004). • One proposed way to mitigate climate change and reduce atmospheric CO2 levels is the storage of CO2 in geological formations (Holloway and Savage 1993, Orr 2004, Kumar et al. 2005, Spiteri et al. 2005).
CO2 sequestration • Several field scale pilot projects have been running for years now, for instance the Sleipner and the Weyburn project (Korbol and Kaddour 1995). • The petroleum industry uses CO2 for enhanced oil recovery (EOR) for many years now (Green and Willhite 1998, Jessen et al. 2005). • There are still many open questions, e.g. how much CO2 can be stored, how fast does the CO2 migrate, how much is dissolved, how much rock is dissolved and precipitated (because of chemical reactions).
Direct Benefits of Research • CO2 storage capacities can be estimated. • Multi-phase flow processes on the pore-scale are analysed; they again determine overall reservoir flow behaviour. • Interfacial areas can be determined; they present a fundamental kinetic parameter in CO2 dissolution and any following chemical reaction. • Grain volume change – porosity change can be analysed; such a change can dramatically change permeability and long-term storage behaviour. • Improved risk assessment, one of the most importat issues associated with the legal and political side of CO2 sequestration.
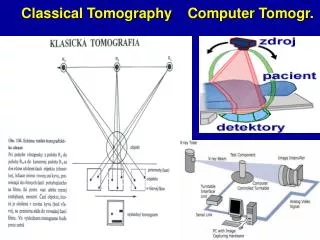
Computer Tomography – Historic background • CT was first used commercially in medical applications. • Since the 1990’s, CT has become an established experimental method in the geological and petroleum engineering sciences. Notable Applications • Investigation of pore structures of sandstones and carbonates (Schena and Favretto 2007, Hu 2007), • Multi-phase flow in sandstones (Wildenschild 2004 & 2005, Culligan 2004) • Estimation of dynamic and static petrophysical parameters such as porosity, permeability, NMR signal, formation factor, saturations, etc. (Arns 2006, Øren and Bakke 2006, Knackstedt 1994 & 2004, Prodanovic and Lindquist 2004).
Computer Tomography Basics Lambert – Beers law I = transmitted beam intensity I0 = incident beam intensity µ = linear attenuation coefficient x = sample thickness i = phase number n = total number of phases C = X-ray source V = Sample volume L = path length inside the object A = projection Π = detector plane
Experimental Setup Picture of experimental setup at Elettra. Sketch of the flow cell.
Flow Cell Preparation • The cylindrical specimen was a 40mm high, 6mm wide pack of unconsolidated quartz sand. • A homogeneous sandpack was compressed and the porosity was determined via mass balance (Φ = 38,93). • Air was displaced by CO2 (to eliminate trapping of gas/air). • A highly concentrated aqueous KI solution (13 wt%) was injected and a CT scan was performed at Sw1. • n-Heptane was injected; when no more brine was produced, another CT scan was performed at the irreducible water saturation, Swi. • CO2 was injected again. Gas injection was stopped when no more liquid production was observed. Another CT scan was taken. • 30 pore volumes (PV) of brine were injected and a final CT scan was taken at the residual gas saturation Sgr .
CT Scanning • We acquired images with a 16bit CCD camera. The camera has a high resolution, 4008 x 2672 pixels, with an active input area of 18 x 12 mm. • The nominal resolution reached was 9 µm. • All CT scans were conducted at an energy level of 28 keV. The sample to detector distance was 10 cm.
Brine saturated sandpack Brine - blue Sand - red Residue CO2 – yellow Light Gray is sand and dark gray is pore volume. • Residue CO2 is located in the largest pore as • expected by capillary pressure theory. • It is almost circular because of surface tension • effects. Gas-brine-quartz grayscale histogram.
Sandpack at irreducible water saturation Brine – blue Sand – red Oil - orange Red volume represents sand, blue brine and yellow oil. • Oil penetrates on average mainly into the larger • pores as expected by capillary pressure • considerations. • Thin water layer is visible on the rock surface as • expected for quartz. • Oil has penetrated into the middle of some pores. Sand brine oil segmentation.
Sandpack at maximum gas saturation Brine – blue Sand – red CO2 - yellow Sand brine gas segmentation. • All large pores and almost all medium-sized pores have • been filled with non-wetting phase, in agreement with • surface free energy considerations. • The thin water layer visible on the rock surfaces is • probably a product of the border enhancing effect.
Sandpack at residual gas Saturation Brine –blue Sand – red CO2 - yellow Red volume represents sand, blue brine and yellow CO2 gas. • The largest CO2 ganglia is continuously spread over the • largest available pore. • Though overall gas accumulates in the larger pores, a random • distribution between large and medium size pores is • observable. • Several tiny gas bubbles are randomly distributed in • the pore volume. Though they might originate from • the segmentation process, it is thought that they are real. Sand brine gas segmentation.
Conclusions • Computer Tomography is a suitable method to visualize fluid saturations in unconsolidated quartz sandpacks in 2D and 3D. • Quartz and brine highly concentrated (13 wt%) with potassium iodide had distinctly different CT numbers and could readily be distinguished in the greyscale histogram • n-Heptane has a low CT number, which again was clearly distinguishable from quartz and doped brine. • Oil penetrated mainly into larger pores of the water-wet sand as expected, but also to a minor extent into medium-sized pores. The brine displacement in the medium pores might have been a kinetic effect due to external pressure fluctuations generating high pressure spots in the fluid system. • A water layer is visible between sand and oil and rock and gas. This phenomenon nevertheless cannot be substantiated with the presented CT images, as these layers might very well be a product of the border enhancing effect during image processing • Gas penetrates into the larger pores. • At the residual gas saturation, gas is trapped in the large pores, but also in some medium-sized pores – the trapping in the medium sized pores might again be due to kinetic effects.
Future Work • Evaluate different consolidated sandstone, dolomite and limestone samples in terms of their CO2 storage capacity. • A new flow cell is designed for this purpose. • Saturations and interfacial areas will be calculated for each saturation state and compared to our petrophysical data from column experiments.
Contributors • Prof. Martin Blunt • Dr. Stefan Iglauer • Stefano Favretto • Andrea Soldan
Observation – Sw1 • Residue CO2 is located in the largest pore as expected by capillary pressure theory as it constitutes the non-wetting phase against the strongly water-wet quartz sand. It is also almost circular, apparently because of surface tension effects – the pore walls distort the gas bubble from its ideal spherical geometry.
Observations -- Swi • Oil penetrates on average mainly into the larger pores as expected by capillary pressure considerations. Nevertheless medium-sized pores are filled with oil before all larger pores are filled. This might be due to end effects or experimental pressure instabilities, which might have introduced a non-uniform pressure front at the inlet. Another explanation for this behaviour might be the heterogeneity of the sand, which contains lignite to a small extent (ca. 0,17 wt%). As lignite is oil-wet, it could imbibe oil into smaller pores, if it is (coincidentally) distributed that way. • In most cases, a thin water layer is visible on the rock surface as expected for quartz; nevertheless the existence of these layers is not evidenced by the presented CT images as these potential layers cannot be separated from the phase contrast/border enhancing effect, which itself produces a “layer-like” interface between two phases. • Moreover, in some pores mainly filled with brine, oil has penetrated into the middle of the pore, completely in agreement with theory which states that oil should appear there first because of surface free energy minimisation (Anderson 1987).
Observations -- Sgmax • All large pores and almost all medium-sized pores have been filled with non-wetting phase, in agreement with surface free energy considerations. Gas has partly filled some of the medium-sized pores in their middle as expected. • Again the thin water layer visible on the rock surfaces is probably a product of the image processing, i.e. border enhancing effect.
Obseravtions -- Sgr • The largest CO2 ganglia is continuously spread over the largest available pore connected to two other large pores. Gas blobs are also located in two further large pores, and in several medium-sized pores. Several tiny gas bubbles are randomly distributed in the pore volume. Though they might originate from the segmentation process, it is thought that they are real. They appear in relatively large pores in the water phase, in accordance with theoretical thermodynamic considerations. The problem to decide whether these small gas bubbles are real or an artefact of the segmentation process is currently one of the most interesting questions associated with CT image analysis. • Though overall gas accumulates in the larger pores, a somewhat random distribution between large and medium size pores is observable. This might again be due to the injection process, which might not have produced a stable and uniform brine pressure front. Therefore this phenomenon could be attributed to a kinetic effect, i.e. gas was pressed into smaller, medium-sized, pores than expected by capillary pressure theory by external pressure, but would relocate into the larger pores over time. There was insufficient CT time to study this kinetic behaviour as it is estimated that this process takes several days to weeks. • It is not unlikely that a thin oil film has developed between the gas and the brine phase as this phenomenon had been observed in previous work (Zhou 1997, Anderson 1987). But as the CT equipment used in this study is limited to a resolution of 9 μm, films with a smaller thickness cannot be observed, even if the segmentation process is faultless. • There is a visible water layer on the rock surfaces separating quartz from gas and maybe a thin oil layer. As before, the existence of this layer cannot be validated with the CT images as it overlaps with the border enhancing effect.