Download
1 / 35
360 likes | 520 Vues
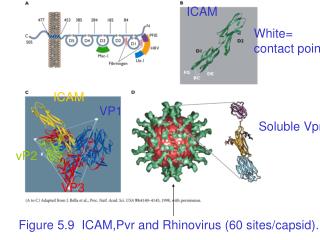
ICAM. White= contact points. ICAM. VP1. Soluble Vpr. vP2. VP3. Figure 5.9 ICAM,Pvr and Rhinovirus (60 sites/capsid).

E N D
ICAM White= contact points ICAM VP1 Soluble Vpr vP2 VP3 Figure 5.9 ICAM,Pvr and Rhinovirus (60 sites/capsid).
Overall structure. The ribbon diagram shows gp120 in red, the N-terminal two domains of CD4 in yellow, and the Fab 17b in light blue (light chain) and purple (heavy chain). The side chain of Phe 43 on CD4 is shown. The prominent CDR3 loop of the 17b heavy chain is evident in this orientation. Although the complete N and C termini of gp120 are missing, the positions of the gp120 termini are consistent with the proposal that gp41, and hence the viral membrane, is located towards the top of the diagram. This would position the target membrane at the diagram base. The vertical dimension of gp120 in this orientation is roughly 50 Å. Perpendicular views of gp120 are shown in Figs 2 and 4. Drawn with RIBBONS49
Figure 2 Structure of core gp120. In a–c, the orientation of gp120 is related to Fig. 1 by a 90° rotation about a vertical axis. Thus the viral membrane would be oriented above, the target membrane below, and the C-terminal tail of CD4 would be coming out of the page. In this view, we describe the left portion of core gp120 as the inner domain, the right portion as the outer domain, and the 4-stranded sheet at the bottom left of gp120 as the bridging sheet. The bridging sheet (3, 2, 21, 20) can be seen packing primarily over the inner domain, although some surface residues of the outer domain, such as Phe 382, reach in to form part of its hydrophobic core. a, Ribbon diagram. -Helices are depicted in red and -strands in salmon, except for strand 15 (yellow), which makes an antiparallel -sheet alignment with strand C" of CD4. Connections are shown in grey, except for the disordered V4 loop (dashed line) connecting 18 and 19. Selected parts of the structure are labelled. b, Topology diagram. The diagram is arranged to coincide with the orientation of a, c, Helices are shown as corkscrews and labelled 1–5. -Strands are shown as arrows: black and labelled represent the 25 -strands of core gp120; grey and unlabelled represent the continuation of hydrogen bonding across a sheet; white and labelled represents the C" strand of CD4.
CD4–gp120 interactions. a, Ribbon diagram of gp120 (red) binding to CD4 (yellow). Residue Phe 43 of CD4 is also depicted reaching into the heart of gp120. From this orientation, the recessed nature of the gp120 binding pocket is evident. b, Electron density in the Phe 43 cavity. The 2Fo - Fc electron density map at 2.5 Å, 1.1 contour, is shown in blue. The gp120 model is depicted in red with the CD4 model in yellow (carbon atoms), blue (nitrogen atoms), and red (oxygen atoms). The orientation is the same as in a. The foreground has been clipped for clarity, removing the overlying 24–5 connection. In the upper middle region lies the central unidentified density. At the bottom, Phe 43 of CD4 reaches up to contact the cavity. Moving clockwise round the cavity, the gp120 residues are Trp 427 (with its indole ring partially clipped by foreground slabbing), Trp 112, Val 255, Thr 257, Glu 370 (packing under the Phe 43 ring), Ile 371 and Asp 368 (partially clipped in the bottom right corner). Hydrophobic residues lining the back of the cavity can be partially seen around the central unidentified density. c, Electrostatic surfaces of CD4 and gp120.
Diagram of gp120 initiation of fusion. A single monomer of core gp120 is depicted (red) in an orientation similar to that in Fig. 2a, c. The '3' symbolizes the 3-fold axis, from which gp41 interacts with the gp120 N and C termini to generate the functional oligomer. In the initial state of gp120 (on the surface of a virion), the V1/V2 loops (salmon) are shown partially occluding the CD4-binding site. Following CD4 binding (now at a target cell, though above the glycocalyx), a conformational change is depicted as an inner/outer domain shift, with the purple circle denoting the formation of the Phe 43 cavity. This conformational change strains the interactions at the N and C termini of gp120 with the rest of the oligomer, priming the CD4-bound gp120 core. In the next step (directly adjacent to the target membrane), the chemokine receptor binds to the bridging sheet and the V3 loop (in green; bottom left and right, respectively, of gp120), causing an orientational shift of core gp120 relative to the oligomer. This triggers further changes, which ultimately lead to the fusion of the viral and target membranes.
Figure 5.18 Uncoating stragegies
Figure 5.19 Penetration and uncoating at the PM Paramyxovyruses e.g. measles and mumps
Figure 5.27 Polio entry model
Figure 5.29 HIV uncoating and cyclophilin A A chaperone destabilizes capsid
Chapter 6: RNA Virus replication and Transcription
Figure 6.2: Protein domain alignments for the 4 categories of NA polymerases
pseudoknot Figure 6.7
Figure 6.8 Polio RNA synthesis
Figure 6.10 Nodoviral expression
Figure 6.11 Activation of Flu RdRp
Figure 6.14 Rolling Circle Replication of Hepatitis Satellite