Download
1 / 20
200 likes | 228 Vues
Explore NARS objectives, indicators, and stressors impacting US water bodies. Learn how NARS improves water quality monitoring.

E N D
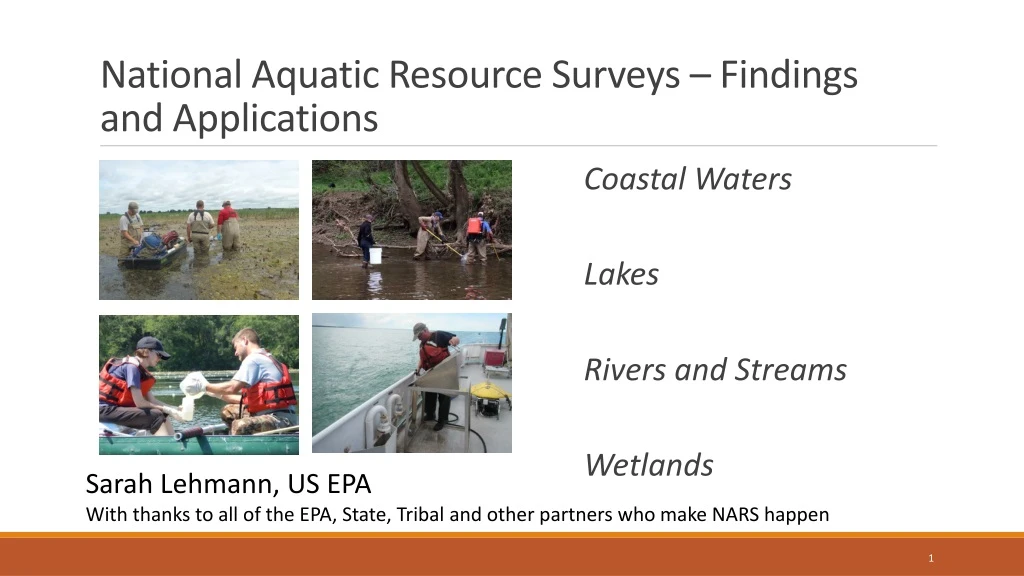
National Aquatic Resource Surveys – Findings and Applications • Coastal Waters • Lakes • Rivers and Streams • Wetlands Sarah Lehmann, US EPA With thanks to all of the EPA, State, Tribal and other partners who make NARS happen
Is Water Quality Getting Better? “I think so but I can’t prove it.” William Reilly - EPA Administrator - 1989 Use multiple monitoring tools: predictive tools, statistical survey designs, targeted monitoring designs, and other innovative approaches Critiques of water monitoring from the 1990s and the early 2000s reported that:
/ Implementing a new approach for filling the information gap
NARS Objectives • Assess the biological/recreational condition and changes over time of the nation’s waters • Rank stressors based on the relative associations between indicators of condition and indicators of stress • Build/enhance state and tribal monitoring and assessment capacity
NARS is the only water quality monitoring program in the U.S. that embodies all of the following elements
Example Survey Indicators and Measures Biological indicators: • Benthic macroinvertebrates • Plants • Fish community Recreational/public health indicators: • Fish tissue • Pathogens • Microcystins Key stressors: • Nutrient enrichment • Excess sediment • Degraded habitat Research indicators: • eDNA • Algal toxins (e.g., NCCA 2015) • Contaminants of emerging concern
What is the biological condition of our waters? Good biological conditions exist in ~50% or less of the nation’s waters Coastal waters, rivers and streams based on benthic macroinvertebrates; wetlands based on plants.
Rivers & Streams – Benthic Macroinvertebrate MMI n = 1853 n = 221 n = 251 n = 218
Wetlands – Vegetation MMI n = 967 n = 276 n = 513 n = 152 n = 67 n = 49 n = 40 n = 47
What stressors are impacting our waters?Nutrients and degraded habitat are problems across the country • Excessive levels of phosphorus are reported in 58% of rivers and streams, 40% of lakes and 21% of coastal waters. • Too much phosphorus contributes to algal blooms, low levels of dissolved oxygen and can harm public health and aquatic life. • Habitat degradation is widespread. 27% of wetland area was found to have high levels of vegetation removal, while 28% of lakes and 24% of river and stream miles are in poor condition based on riparian vegetation cover. • Loss of vegetation along shorelines can contribute to runoff of sediment, pollutants and trash.
Probability: Shows significant change across the country (deterioriation)Without probability surveys, we could miss this change • Stoddard, et al. (National Aquatic Resource Surveys data)
Lakes – Riparian Vegetation n = 1038 n = 90 n = 89 n = 126
Coastal – Sediment Quality Index n = 1104 n = 185 n = 87 n = 240 n = 94
What is the impact of these stressors? Excess nutrients and poor habitat increase the likelihood of degraded biological condition • Poor biological condition is: • almost twice as likely in wetlands when vegetation removal is extensive or high level of compacted soil are present. • 1.5 to 2 times as likely when habitat is poor or nutrients are high in lakes. • more than 1.5 times as likely in rivers and streams with high levels of phosphorus or nitrogen. • NARS analysis shows that if we reduced the levels of these stressors we could see biological condition improve in 20 to 35% of our waters NRSA: Potential Impact of Reducing Phosphorus (draft)
Effectiveness Tracking Change Across the State with Statistical Survey Percent of Stream Miles meeting Biological Expectations in Virginia From Using Probabilistic Monitoring to Assess the Effectiveness of Stream Management Efforts; Willis, Hill, Jones, Dail; VA DEQ
VT DEC:NLA results support recommendations for changes in shoreland protection legislation “It was the findings of NLA07, and specifically the overdraw results from VT, as compared to regional and national conditions that provided the first major scientific piece of information that caught our legislature’s attention” Neil Kamman, VTDEC
Developing sediment thresholds for water quality standards assessments in New Mexico • New Mexicoused NRSA methods and data, along with other data, to develop and propose numeric translators for New Mexico’s narrative sedimentation water quality narrative standard. • This translator is used for integrated report (305(b)/303(d)) decisions.
NARS 2.0 – Enhancements and Exploration of Alternative Implementation Strategies • Data Delivery • State/EPA workgroup initiated: draft data tracking tool for partners developed and shared • Work progressing to facilitate transfer of current NARS data into WQX • Communication and Outreach • State/EPA workgroup initiated: landowner communication tools • Methods and Indicators • State/EPA workgroup initiated: Review of Survey Technical Support Documents • Methods alignment discussions initiated • Training • Developing and planning to pilot new approaches (videos, voice over PPTs/webinars) to help shorten on-site training • Design Implementation Proposal
For more information • Me: lehmann.sarah@epa.gov; 202 566-1379 • NARS website: https://www.epa.gov/national-aquatic-resource-surveys • NARS data: https://www.epa.gov/national-aquatic-resource-surveys/data-national-aquatic-resource-surveys
Questions? Outreach Materials


