Download
1 / 45
450 likes | 686 Vues
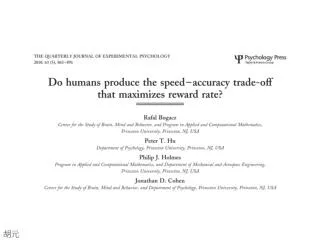
胡元. In the Drift Diffusion Model, the height of the threshold controls the speed–accuracy trade-off. Drift Diffusion Model. What if the participant not explicitly told to emphasize speed or accuracy? . Response correct → reward (score) → delay → next trial

E N D
In the Drift Diffusion Model, the height of the threshold controls the speed–accuracy trade-off
What if the participant not explicitly told to emphasize speed or accuracy?
Responsecorrect→ reward (score)→ delay→ next trial Response incorrect→ delay + delay penalty→ next trial Gold, J. I., & Shadlen, M. N. (2002). Banburismus and the brain: decoding the relationship between sensory stimuli, decisions, and reward. Neuron, 36(2), 299-308.
Optimal threshold: maximize RR Bogacz, R., Brown, E., Moehlis, J., Holmes, P., & Cohen, J. D. (2006). The physics of optimal decision making: A formal analysis of models of performance in two- alternative forced choice tasks. Psychological Review, 113, 700–765.
1. Optimal threshold is higher for longer D: lower ER and longer RT in blocks of trials with longer D Prediction
3. The values of decision thresholds should match the optimal values that maximize RR. Prediction
4. The RT, plotted as a function of ER, should follow a particular relationship defined by the optimal performance curve Prediction
Prediction z ~D z(D + Dp ) → z(D + Dp + T0 ) z = z0 DT(ER)
Prediction z ~D z(D + Dp ) → z(D + Dp + T0 ) z = z0 DT(ER)
Maximization of RR and accuracy: weighted sum of RR and accuracy q: the weight accorded to accuracy
Maximization of RR and accuracy: weighted sum of RR and accuracy : 錯誤的損失 q: the weight accorded to accuracy
Modified RR Participant receives a unit of reward for a correct choice andloses q units of reward for an error
Stimuli (until response) Responsecorrect→ reward (score)→ D→ next trial Response incorrect→ D + Dp→ next trial
(1) D = 0.5 sec(2) D = 1 sec(3) D = 2 sec(4) D =0.5 sec, Dp=1.5 sec Delay condition: blocked design
Exp. 1: 5 blocks, each lasting 7 minsExp. 2: 10 blocked, each lasting 4 mins
Behavioral data ER:Delay F(3)=5.84*** RT: Delay F(3)=2.02, n.s.
Prediction: z ~ D confirmed r = -.53*** r = .29*
Prediction z ~D z(D + Dp ) → z(D + Dp + T0 ) z = z0 DT(ER)
Prediction: z(D + Dp) (3) D = 2 sec(4) D = 0.5 sec, Dp=1.5 sec ER: t(19)=2.23* RT: t(19)=2.49* Not confirmed in behavioral data
Strong correlation between pure/extend DDM → pure DDM as a tool to investigateSAT
Decision threshold r1*** r1**
Suboptimal threshold (Participants set their threshold higher)
Behavioral data ER:Difficulty F(1)=103***Delay F(3)=3.79**Interaction F(3)=0.67, n.s. RT: Difficulty F(1)=870***Delay F(3)=9.04***Interaction F(3)=.52, n.s.
Prediction: z ~ D confirmed r = -.32*** r = .31***
Prediction: z(D + Dp) (3) D = 2 sec(4) D=0.5 sec, Dp=1.5 sec ER: t(119)=.43, n.s. RT: t(119)=2.88** Not confirmed in behavioral data
Suboptimal threshold (Participants set their threshold higher)
Theory matching error Gender comparison: t(58)=2.13*
Performance of participants with high reward scores (above median)
Prediction: z(D+Dp) confirmed n.s. n.s.