Download
1 / 20
220 likes | 439 Vues
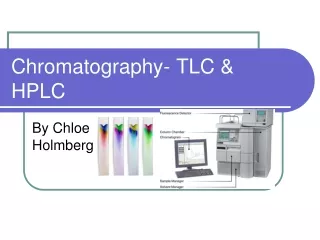
Chromatography- TLC & HPLC. By Chloe Holmberg. TLC- Thin Layer Chromatography. TLC. The stationary phase of TLC is a thin layer of fine powder (eg. Alumina) spread on a glass or plastic plate. The mobile phase is the solvent. TLC is similar to paper chromatography.

E N D
Chromatography- TLC & HPLC By Chloe Holmberg
TLC • The stationary phase of TLC is a thin layer of fine powder (eg. Alumina) spread on a glass or plastic plate. • The mobile phase is the solvent. • TLC is similar to paper chromatography. • Is suitable for qualitative analysis
TLC- Steps involved in TLC • Place a small spot of the sample being analysed at one end of the plate (this is the origin) • Put the end of the plate in solvent so that the origin mark is above the solvent. • Remove the plate from the solvent before the solvent front reaches the top of the plate.
TLC- The chemistry behind TLC • The components being analysed in the sample undergo continuous adsorption (where the substance bonds with the surface of the plate) and desorption (where these bonds break) back into the liquid mobile phase. • The rate of movement of each individual component in the sample causes different Rf values of each of these components. • This rate of movement is caused by how strongly it adsorbs onto the plate and how readily it dissolves back into the mobile phase.
TLC-Interpreting TLC chromatograms • Rf value can be used to identify the compounds present in the mixture by comparing the Rf value of each component with the Rf value of a known substance under identical conditions. • Rf value will always be less than 1. • Rf value can alter if temperature, type of stationary phase used, amount of water vapor surrounding the plate, or solvent type are changed during the chromatography process. • Also substances can be identified by running standards of known chemicals on the same chromatogram as the unknown sample.
TLC- Limitations and advantages • TLC is only useful for qualitative analysis as it will only determine if a substance is present in a chemical, not how much is present (quantitative analysis). • However this method is fast, cheaper than column chromatography, is able to detect the smallest amount of a substance present in the chemical, will work with corrosive materials and provides better separation of less polar compounds.
TLC- Elutropic series • This is a list of popular solvents in order of their polarity. Whether a solvent used in the mobile phase has high polarity or low polarity will depend on the samples polarity • Where more polar compounds will normally require a more polar solvent. • If unsure of the samples polarity, a solvent such as acetone which has medium polarity will be most appropriate to use for the experiment. • The component which adsorbs onto plate the most will move the least distance, having the lowest Rf value and this will be the more polar component of the sample.
TLC Elutropic series Nb.- if the substance you are trying to test is colourless, by putting the plate under UV light, the components will come up as dark spots which are only visible under this light. http://www.chem-ilp.net/labTechniques/TLCAnimation.htm
Bibliography- TLC • http://www.chem-ilp.net/labTechniques/ElutropicSeries.htm • http://www.chemguide.co.uk/analysis/chromatography/thinlayer.html
HPLC- High Performance/Pressure Liquid Chromatography Detector sends a signal to the recorder which shows the amount of each component in the sample in a peak. HPLC Column Pump & solvent reservoir Sample injection point
HPLC • Stationary phase of HPLC is the solids of very small particle size packed into a column. • Liquid mobile phase is the solvent which is dripped into the column from the reservoir above. A tap at the bottom of the column allows the solvent (now called the eluent) to leave the column at the same rate it entered at. • HPLC is suitable for qualitative and quantitative analysis.
HPLC- Apparatus • The column • Has a typical internal diameter of 4.6mm and can be 25cm long. • It is packed with tiny polar silica particles (which are the solid stationary phase). • These tiny particles create resistance of flow for the solvent travelling through the column causing the need for a pump to force the mobile phase through under high pressure of about 14000kPa. • Small size of solid silica particles allows more frequent adsorption and desorption of components (as with the solvent and paper in TLC) between the silica particles and the solvent. • The most strongly adsorbed component of the sample will take the longest to pass through the column, while the least adsorbent component will go through more quickly, this is how HPLC separates the components of a compound.
HPLC- Apparatus • The solvent (liquid mobile phase) • Non-polar solvent is used (eg. Hexane) as this will not adsorb with the polar silica particles for very long, therefore, will pass through the column quickly. • The solvent enters the column from the reservoir above and is pumped into the column at around 14000kPa. It is slowly dripped into the column and a tap at the bottom of the column allows the solvent to leave the column at the same rate with which it entered. • The solvent which has left the column is called the eluent.
HPLC- Apparatus • The detector • Components in the sample are detected by passing the solvent, which has been separated in the column, through a thin beam of UV light. This light is picked up by the detector which measures how much light it is receiving. • As the components pass through this beam they absorb some of the UV light and the detector picks up this change and sends a signal to the recorder screen. • Different components will absorb different amounts of light depending on how much of a particular compound is passing through the beam at that time. • This method is called UV absorption.
HPLC- Interpreting HPLC chromatograms • Once the detector has picked up how much UV light it is receiving, it sends a signal to a recorder which moves at a constant pace and as components pass through the UV beam, draws a peak on the chromatogram, while the solvent will draw up as a flat baseline. • The time taken for the sample to pass through the column is called the retention time (Rt). • Under identical conditions, the same component will give the same Rt and by comparing a sample with other chromatograms of known solutions, we are able to determine the components in the unknown sample. • The amount of a component in the solution is proportional to the area under the peak. • Quantitative analysis of HPLC is done by running a series of standards of known concentration and comparing their peak size with that of the sample. • Quantitative analysis can also be determined by plotting the peak height against the concentration on a calibration curve.
HPLC- Limitations & advantages • Allow chemists to determine very small quantities of components present in a sample. • Able to identify a wide range of materials • Is able to be linked to mass spectroscopy to enhance analysis of components. • However the equipment is expensive.
HPLC • HPLC machines do not require calibration. The chromatograms are all done on a computer which will scale it automatically and even the injection of the sample is automated. • HPLC is able to identify and separate very complex mixtures in similar compounds, such as drugs or sleeping tablets in the blood making it an ideal procedure for hospitals in testing patients for suspected overdose. http://www.studyhplc.com/animatedsimulation.php
bibliography- HPLC • http://www.chemguide.co.uk/analysis/chromatography/hplc.html#top • http://www.google.com.au/imgres?q=HPLC+chromatograms+and+calibration+curve+benzene&hl=en&gbv=2&biw=1117&bih=675&tbm=isch&tbnid=mR8JtAFDCKmYQM:&imgrefurl=http://www.sciencedirect.com/science/article/pii/S0021967307004803&docid=Y5q6zEgG0RFBQM&imgurl=http://origin-ars.sciencedirect.com/content/image/1-s2.0-S0021967307004803-gr2.gif&w=301&h=489&ei=vr-CT7W-B6ekiAe_v-HSBA&zoom=1&iact=hc&vpx=792&vpy=167&dur=15&hovh=286&hovw=176&tx=80&ty=139&sig=110398246544391041133&page=1&tbnh=147&tbnw=90&start=0&ndsp=18&ved=1t:429,r:4,s:0,i:76 • http://www.google.com.au/imgres?q=HPLC+chromatograms+and+calibration+curve+basic&hl=en&gbv=2&biw=1117&bih=675&tbm=isch&tbnid=KYLm71dDWQbAKM:&imgrefurl=http://www.boomer.org/c/p3/c03/c0305.html&docid=9RfWgWINLl5uxM&imgurl=http://www.boomer.org/c/p3/c03/Fig19.gif&w=606&h=393&ei=s76CT8TUN7C0iQe8_8nVBA&zoom=1&iact=hc&vpx=334&vpy=360&dur=2281&hovh=181&hovw=279&tx=128&ty=74&sig=110398246544391041133&page=1&tbnh=131&tbnw=202&start=0&ndsp=15&ved=1t:429,r:6,s:0,i:81