Comparative Genomics and Evolution
Comparative Genomics and Evolution. Pollard, K.S., et al., Forces Shaping the Fastest Evolving Regions in the Human Genome. PLoS Genetics 2(10), 2006. McLean, C., and Bejerano, G., Dispensability of Mammalian DNA. Genome Research 18, 1743-1751 (2008).

Comparative Genomics and Evolution
E N D
Presentation Transcript
Comparative Genomics and Evolution Pollard, K.S., et al., Forces Shaping the Fastest Evolving Regions in the Human Genome. PLoS Genetics 2(10), 2006. McLean, C., and Bejerano, G., Dispensability of Mammalian DNA. Genome Research 18, 1743-1751 (2008). Image from: McLean, C., and Bejerano, G., Dispensability of Mammalian DNA. Genome Research 18, 1743-1751 (2008). Image source: http://mbbnet.umn.edu
“Forces shaping the fastest evolving regions in the human genome” by Katherine S. Pollard et al.
What’s the difference? Image sources: http://pro.corbis.com, http://www.science.psu.edu
Humans have higher “brainpower” • Examples: creativity, problem solving, language • What part of the genome is the cause? What’s the difference? Image source: http://www.spaceflight.esa.int
What’s the difference? • Human and chimpanzee DNA is 98% similar • The 2% difference is 29 million bases (mostly in non-coding DNA) Image source: http://en.wikipedia.org
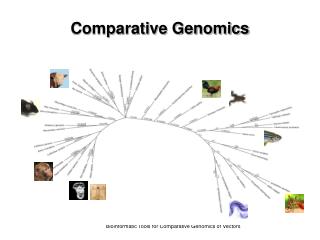
Human and rodent genomes are often compared to identify conserved (presumably functional) elements. • Humans and chimpanzees are compared to understand what is uniquely human about our genome. Comparative Genomics Image source: http://genome.ucsc.edu
Look at HARs in human genome • HAR - human accelerated region. High rate of nucleotide substitution in humans, low in other vertebrates. • Fastest is HAR1 – novel RNA gene expressed in development of neocortex (language, conscious thought). Comparative Genomics
~ 100 bp, mostly non-coding • Function is likely to be gene regulation. • Seem to have been under strong negative selection up to common ancestor of chimp and human. • Rapid positive selection then started in humans only. HARs Image source: http://www.shutterstock.com
Branch lengths given in substitutions per base, or in millions of years Evolution of vertebrates Finding HARs • Evolutionary tree based on the comparison of conserved regions in whole-genome alignments between species. Image from: Pollard, K.S., et al., Forces Shaping the Fastest Evolving Regions of the Human Genome.
Find HARs by using LRT, the likelihood ratio test. • In statistical hypothesis testing, the likelihood ratio (Λ) is the ratio of the maximum probability of a result under a null hypothesis and alternative hypothesis. • The LRT decides between the two hypothesis based on the value of the likelihood ratio. Finding HARs
Two models were used for genomic LRT. • Model 1: human substitution rate is held proportional to the other substitution rates in the evolutionary tree. • Model 2: human substitution rate can be accelerated relative to the rates in the rest of the tree. Finding HARs
. . . Human . . . Another vertebrate . . . . . . . . . Finding HARs All the conserved alignments
Model 1 . . . Human . . . Another vertebrate . . . . . . . . . Finding HARs Determine 1st set of rates Determine 2nd set of rates Determine 3rd set of rates Scale all by the same amount
Model 2 . . . Human . . . Another vertebrate . . . . . . . . . Finding HARs Scale all by the same amount Scale the human rates separately
Identify regions conserved between human and other vertebrates (34,498 of them)
Identify regions conserved between human and other vertebrates (34,498 of them) For all regions, fit model 1 and determine the proportional rates that maximize the likelihood of the tree Obtain P1 (max probability 1)
Identify regions conserved between human and other vertebrates (34,498 of them) For all regions, fit model 1 and determine the proportional rates that maximize the likelihood of the tree Obtain P1 (max probability 1) Loop over all conserved regions. For each region, do:
Identify regions conserved between human and other vertebrates (34,498 of them) For all regions, fit model 1 and determine the proportional rates that maximize the likelihood of the tree Obtain P1 (max probability 1) Loop over all conserved regions. For each region, do: Calculate LRT for the region as Λ = log(P2 / P1) Fit model 2 to the region in human, find acceleration for that region that maximizes the likelihood of the tree Obtain P2 (max probability 2)
Big LRT value indicates an HAR. How big is big? • Do 1 million simulations of the 34,498 conserved alignments. • To create each simulation, use the model 1 proportional rates. • Repeat the LRT calculation for each simulation. • Then for each region, find proportion of simulated LRTs that are bigger than its original LRT. • That proportion is a p-value that tells if the region is an HAR. Finding HARs
Note on methods: vertebrates that were used in selecting the conserved regions (chimp, macaque, mouse, rat, rabbit) were omitted from any LRT analysis. • This ensured that the LRT test is independent of the method used to select the conserved regions. Finding HARs
Result: 202 HARs were found in the human genome. Finding HARs Image source: http://www.3dscience.com
80.4% of the 34,498 conserved regions are non-coding. • 45.4% of non-coding regions are intronic, 31% are intergenic, • Non-coding regions are enriched for transcription factors, DNA-binding proteins, regulators of nucleic acid metabolism Results for Conserved Elements
202 HARs have p < 0.1, 49 of them have p < 0.05 • HAR1 through HAR5 have p < 4.5e-4, very accelerated • Most HARs are non-coding • 66.3% are intergenic, 31.7% are intronic, only 1.5% are coding • Results support the hypothesis (King and Wilson) that most chimp-human differences are regulatory. Results for HARs
Negative selection Positive selection Results: Confirming Accelerated Selection in HARs • Are the HARs just due to relaxation of negative selection? • No. Compare to neutral rate for 4D sites to see. Image source: http://cs273a.stanford.edu [Bejerano Aut 08/09]
Genome-wide neutral rate for 4D sites in human and chimp in chromosome end bands Genome-wide neutral rate for 4D sites in human and chimp The chimp rates in all five elements fall well below the human rates, which exceed the background rates by as much as an order of magnitude. H, human; C, chimp. Image from: K.S. Pollard et al., Forces Shaping the Fastest Evolving Regions of the Human Genome.
AT GC substitution bias in HARs HAR1 – HAR5 AT GC HAR6 – HAR49 GC AT HAR50 – HAR202 Results: W S Bias in HARs Rest of ~ 34000 conserved elements • Dramatic AT GC bias was observed in HARs. Image from: Pollard, K.S., et al., Forces Shaping the Fastest Evolving Regions of the Human Genome.
Results: W S Bias in HARs • Top 49 HARs are 2.7 times as likely to be located near final chromosomal bands as the other conserved elements • Interestingly, HAR1 and HAR5 are also in end regions in other mammals, but are not accelerated. Image source: http://www.intelihealth.com
HARs tend to be located in regions of high recombination in humans. • All of this evidence points to biased gene conversion (BGC) as the driving force behind HARs. Results: W S Bias in HARs
Paired chromosomes can exchange homologous pieces • Typically occurs during meiosis Genetic Recombination
Meiosis diploid germ cell paternal chromosome A maternal chromosome A
Meiosis diploid germ cell paternal chromosome A maternal chromosome A DNA replication centromere sister chromatids
Meiosis diploid germ cell paternal chromosome A maternal chromosome A DNA replication centromere sister chromatids Recombination
Meiosis diploid germ cell paternal chromosome A maternal chromosome A DNA replication centromere sister chromatids Recombination Segregation
Meiosis diploid germ cell paternal chromosome A maternal chromosome A DNA replication centromere sister chromatids Recombination Segregation haploid gametes
Recombination hotspot Recombination
duplex 1 duplex 2 Formation of Holliday Junction intermediate Horizontal resolution with gene conversion Vertical resolution with crossover Genetic Recombination Mismatch repair or Image source: http://www.sanger.ac.uk
Homologous chromosomes Genetic Recombination: Chromosomal Crossover Recombinant chromatids • Chromosomal crossover results in exchange of DNA pieces Image source: http://www.emc.maricopa.edu
Genetic Recombination: Gene Conversion Mismatch repair causes DNA to revert back to its original form Recombinant chromatids • Gene conversion results in nonreciprocal transfer of DNA Image source: http://www.emc.maricopa.edu
Genetic Recombination: Gene Conversion haploid gametes • The result is a nonstandard ratio of alleles, such as 3:1 • This causes homogenization of a species’ gene pool Image source: http://www.emc.maricopa.edu
A - T is a weak pairing Biased Gene Conversion G - C is a strong pairing • DNA repair machinery likes to replace weak pairings with strong pairings during gene conversion. Image source: http://commons.wikimedia.org
Biased Gene Conversion Recombinant chromatids A – T replaced by G – C during mismatch repair • Biased gene conversion results in G – C enrichment of a species’ gene pool (in addition to causing homogenization)
HARs tend to be located near recombination hotspots in humans HARs and Recombination Hotspots
Mysterious • Extremely different between chimps and humans (change rapidly during evolution) • Not caused by the local DNA sequence (it is the same in human and chimp) Recombination Hotspots
Recombination hotspots ? Some HARs
Recombination-caused BGC (often seen negatively) played a big role in the development of our species. Possible Conclusion
HAR HAR Isochore Alternative Explanation • Isochore – DNA region (~100 kb) with high gene concentration • Isochores are stabilized by many strong (GC) pairings
Theory (Bernardi et al.) that weakly deleterious changes drive isochore to a critical point of destabilization • At critical point, GC content cannot decrease – otherwise isochore becomes unstable • AT GC substitution in the isochore suddenly gains selective advantage and sweeps through the population Alternative Explanation
Isochore selective sweep theory vs. the BGC theory. • Isochore sweep has a different DNA signature than BGC Isochore selective sweep GC GC GC GC GC GC GC Alternative Explanation ~ 100 kb Biased gene conversion GC GC GC GC GC GC GC ~ 100 bases
Evidence so far favors the BGC explanation for HARs • However, the results are not yet conclusive Alternative Explanation
“Dispensability of Mammalian DNA” by Gill Bejerano and Cory McLean