

SlideServe
Menu
Préférences
© SlideServe · v2026

Intro:

bijan avatar
1 diapositives · 229 Views · Oct 20, 2014

Data: Here are some of the links that we would like to base our data off of. Once we have sorted through our data, we will create a meta study and post our data here. http ://religions.pewforum.org/pdf/affiliations-all- traditions.pdf
Intro: - slide 1
01 / 1Intro:
1 / 17

Télécharger la présentation

Intro:
Une image / un lien ci-dessous est fourni (tel quel) pour télécharger la présentation

Politique de téléchargement : le contenu du site vous est fourni TEL QUEL pour votre information et votre usage personnel ; il ne peut être vendu, concédé sous licence ni partagé sur d’autres sites sans l’accord de son auteur.Le contenu vous est fourni TEL QUEL, pour votre information et votre usage personnel uniquement. Téléchargez la présentation en cliquant sur ce lien. Lors du téléchargement, si vous ne parvenez pas à télécharger une présentation, l’éditeur a peut-être supprimé le fichier de son serveur.Pendant le téléchargement, si vous ne parvenez pas à obtenir une présentation, le fichier a peut-être été supprimé par l’éditeur.

F I N

Plus de contenu associé

Transcription de la présentation
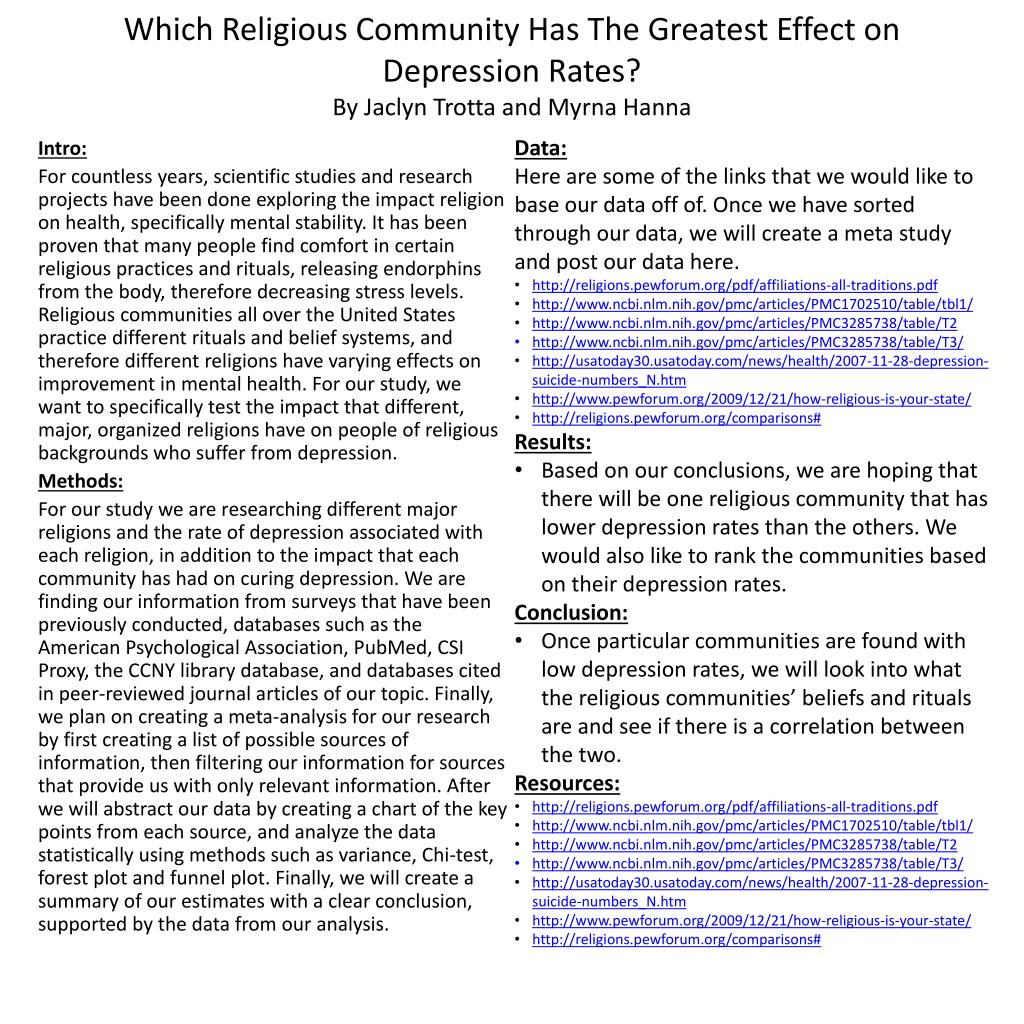
  1. Data: • Here are some of the links that we would like to base our data off of. Once we have sorted through our data, we will create a meta study and post our data here. • http://religions.pewforum.org/pdf/affiliations-all-traditions.pdf • http://www.ncbi.nlm.nih.gov/pmc/articles/PMC1702510/table/tbl1/ • http://www.ncbi.nlm.nih.gov/pmc/articles/PMC3285738/table/T2 • http://www.ncbi.nlm.nih.gov/pmc/articles/PMC3285738/table/T3/ • http://usatoday30.usatoday.com/news/health/2007-11-28-depression-suicide-numbers_N.htm • http://www.pewforum.org/2009/12/21/how-religious-is-your-state/ • http://religions.pewforum.org/comparisons# • Results: • Based on our conclusions, we are hoping that there will be one religious community that has lower depression rates than the others. We would also like to rank the communities based on their depression rates. • Conclusion: • Once particular communities are found with low depression rates, we will look into what the religious communities’ beliefs and rituals are and see if there is a correlation between the two. • Resources: • http://religions.pewforum.org/pdf/affiliations-all-traditions.pdf • http://www.ncbi.nlm.nih.gov/pmc/articles/PMC1702510/table/tbl1/ • http://www.ncbi.nlm.nih.gov/pmc/articles/PMC3285738/table/T2 • http://www.ncbi.nlm.nih.gov/pmc/articles/PMC3285738/table/T3/ • http://usatoday30.usatoday.com/news/health/2007-11-28-depression-suicide-numbers_N.htm • http://www.pewforum.org/2009/12/21/how-religious-is-your-state/ • http://religions.pewforum.org/comparisons# Which Religious Community Has The Greatest Effect on Depression Rates?By Jaclyn Trotta and Myrna Hanna Intro: For countless years, scientific studies and research projects have been done exploring the impact religion on health, specifically mental stability. It has been proven that many people find comfort in certain religious practices and rituals, releasing endorphins from the body, therefore decreasing stress levels. Religious communities all over the United States practice different rituals and belief systems, and therefore different religions have varying effects on improvement in mental health. For our study, we want to specifically test the impact that different, major, organized religions have on people of religious backgrounds who suffer from depression. Methods: For our study we are researching different major religions and the rate of depression associated with each religion, in addition to the impact that each community has had on curing depression. We are finding our information from surveys that have been previously conducted, databases such as the American Psychological Association, PubMed, CSI Proxy, the CCNY library database, and databases cited in peer-reviewed journal articles of our topic. Finally, we plan on creating a meta-analysis for our research by first creating a list of possible sources of information, then filtering our information for sources that provide us with only relevant information. After we will abstract our data by creating a chart of the key points from each source, and analyze the data statistically using methods such as variance, Chi-test, forest plot and funnel plot. Finally, we will create a summary of our estimates with a clear conclusion, supported by the data from our analysis.