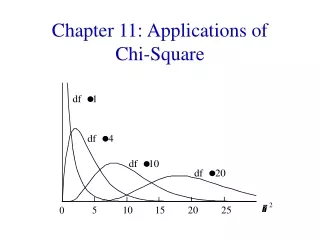
Chapter 11 Chi-Square Procedures
Chapter 11 Chi-Square Procedures. 11.3 Chi-Square Test for Independence; Homogeneity of Proportions.

Chapter 11 Chi-Square Procedures
E N D
Presentation Transcript
Chapter 11Chi-Square Procedures 11.3 Chi-Square Test for Independence; Homogeneity of Proportions
The chi-square independence test is used to determine whether there is association between a row variable and column variable in a contingency table constructed from sample data. The null hypothesis is that the variables are not associated, or independent. The alternative hypothesis is that the variables are associated, or dependent.
In a chi-square independence test, the null hypothesis is always Ho: the variables are independent The alternative hypothesis is always H1: the variables are dependent
The idea behind testing these types of claims is to compare actual counts to the counts we would expect if the null hypothesis were true (if the variables are independent). If a significant difference between the actual counts and expected counts exists, we would take this as evidence against the null hypothesis.
The method for obtaining the expected counts requires that we determine the number of observations within each cell under the assumption the null hypothesis is true.
If two events are independent, then P(A and B) = P(A) .P(B) We can use the Multiplication Principle for independent events to obtain the expected proportion of observations within each cell under the assumption of independence and multiply this result by, n, the sample size in order to obtain the expected count within each cell.
EXAMPLE Determining the Expected Counts in a Test for Independence In a poll, 883 males and 893 females were asked, “If you could have only one of the following, which would you pick: money, health, or love?” Their responses are presented in the table below. Determine the expected counts within each cell assuming that gender and response are independent. Source: Based on a Fox News Poll conducted January, 1999
Expected Frequencies in a Chi-Square Independence Test To find the expected frequencies in a cell when performing a chi-square independence test, multiply the row total of the row containing the cell by the column total of the column containing the cell and divide this result by the table total. That is
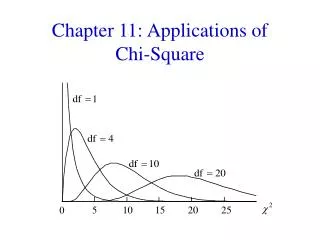
Test Statistic for the Test of Independence Let Oi represent the observed number of counts in the ith cell, Ei represent the expected number of counts in the ith cell. Then, approximately follows the chi-square distribution with(r – 1)(c – 1) degrees of freedom where r is the number of rows and c is the number of columns in the contingency table provided (1) all expected frequencies are greater than or equal to 1 and (2) no more than 20% of the expected frequencies are less than 5.
The Chi-Square Test for Independence If a claim is made regarding the association between (or independence of) two variables in a contingency table, we can use the following steps to test the claim provided 1. the data is randomly selected
The Chi-Square Test for Independence If a claim is made regarding the association between (or independence of) two variables in a contingency table, we can use the following steps to test the claim provided 1. the data is randomly selected 2. all expected frequencies are greater than or equal to 1.
The Chi-Square Test for Independence If a claim is made regarding the association between (or independence of) two variables in a contingency table, we can use the following steps to test the claim provided 1. the data is randomly selected 2. all expected frequencies are greater than or equal to 1. 3. no more than 20% of the expected frequencies are less than 5.
Step 1. A claim is made regarding the independence of the data. Ho: the row variable and column variable are independent H1: the row variable and column variable are not independent
Step 2: Calculate the expected frequencies (counts) for each cell in the contingency table.
Step 3: Verify the requirements for the chi-square test for independence are satisfied. • (1) all expected frequencies are greater than or equal to 1 (all Ei> 1) • (2) no more than 20% of the expected frequencies are less than 5.
EXAMPLE Testing for Independence Source: Based on a Fox News Poll conducted January, 1999
In a chi-square test for homogeneity of proportions we test the claim that different populations have the same proportion of individuals with some characteristic.
EXAMPLE A Test of Homogeneity of Proportions The following question was asked of a random sample of individuals in 1992, 1998, and 2001: “Would you tell me if you feel being a teacher is an occupation of very great prestige?” The results of the survey are presented below: Source: The Harris Poll