Download

1 / 13
180 likes | 551 Vues
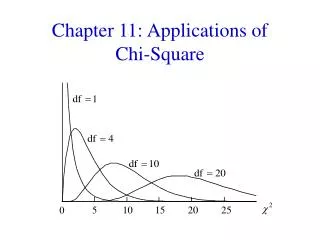
Chapter 11 Chi Square Distribution and Its applications. What is a Chi Square?. Chi Square is another probability distribution (like Normal and Student t) Symbol: χ 2 Picture. 0. What is a Chi Square? (cont). Features: Mode (i.e. Peak) at n – 2.

E N D
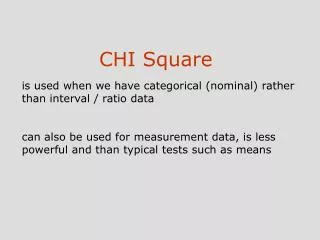
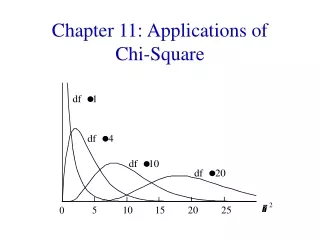
What is a Chi Square? Chi Square is another probability distribution (like Normal and Student t) Symbol: χ2 Picture 0
What is a Chi Square? (cont) Features: Mode (i.e. Peak) at n – 2. Degrees of Freedom = n – 2. 0
Why χ2? The χ2 distribution allows you to test the independence of two factors. For instance, what about getting a tattoo and the frequency of Hepatitis C? What if you got the tattoo in a tattoo parlor? What if your cousin Dwayne gave you that great tattoo of Count Chocula? The Chi Squared test for independence allows you to decide whether the chance of having hepatitis is independent of the tattoo status.
Requirements 1. Counted Data Condition: Data must be in counts 2. Randomization Condition: Individuals who have been counted should be a random sample from some population. 3. Expected Cell Frequency Condition: The expected values (which you will calculate) should all be at least 5.
What to do? Use a contingency table to find the differences between observed and expected values.
What to do? Use a contingency table to find the differences between observed and expected values. d.f. = (R-1)(C-1) where R and C are the number of rows/columns
Lets Try one We have counts of 626 individuals categorized according to their “tattoo status” and their “hepatitis status”.
We want to test whether tattoo status and hepatitis status are independent. HO: Tattoo status and hepatitis status are independent HA: Tattoo status and hepatitis status are not independent Check the conditions: 1. Counts of data categorized 2. While you don’t have the information, you can assume that they were selected to avoid biases. 3. We’ll find out when we determine E for each cell
Compute E 48.096 3.904 56.420 4.580 38.516 474.484
Notice There are some values below 5 – we’ll continue from here for the sake of the data. What are the degrees of freedom? Find the χ2 value. Using a table, the value for P(χ2 >57.91) 2 57.91 Less than .0001
Conclusion The P-value is very small, so I reject the null hypothesis and conclude that hepatitis status is not independent of tattoo status.
Resources www.microbiologybytes.com/maths/graphics/chi.gif