Chapter 11 Chi-Square Distribution
Chapter 11 Chi-Square Distribution. Review. So far, we have used several probability distributions for hypothesis testing and confidence intervals with normal distribution and Student’s t distribution. In this section, we will be using chi- squre. What is Chi-Square?. = Chi-Square

Chapter 11 Chi-Square Distribution
E N D
Presentation Transcript
Review • So far, we have used several probability distributions for hypothesis testing and confidence intervals with normal distribution and Student’s t distribution. • In this section, we will be using chi-squre.
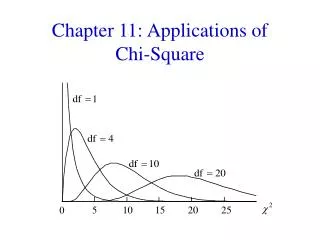
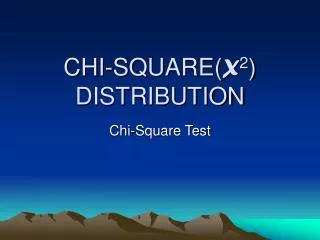
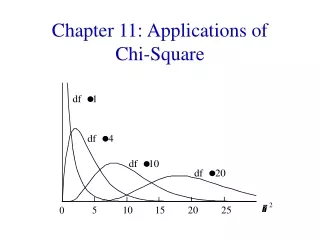
What is Chi-Square? • = Chi-Square • The values begin at 0 and then all are positive. The graph of is not symmetrical, and like student’s t distribution, it depends on the number of degrees of freedom. • It can determine if random variables are dependent or independent. • It can determine if different populations share the same proportions of specified characteristics.
Mode (high point) • The mode (high point) of a chi-square distribution with n degrees of freedom occurs over n-2 (for
Formula for • O= observed • E= expected
Degrees of Freedom • Degrees of freedom = (number of rows – 1)(Number of columns – 1) • R= number of cell rows • C=number of cell columns
Example: (The situation) • Innovative Machines Incorporated has developed two new letter arrangements for computer keyboards. The company wishes to see if there is any relationship between the arrangement of letters on the keyboard and the number of hours it takes a new typing student to learn to type at 20 words per minute. Or, from another point of view, is the time it takes a student to learn to type independent of the arrangement of the letters on a keyboard? Use 5% level of significance
Example: (step 1) • Keyboard arrangement and learning times are independent • Keyboard arrangement and learning times are not independent
Answer for E (will show in class) Remember
What is then? • Add up all the numbers
Example: (Degrees of freedom for test of independence) • d.f.=4
Conclusion • Look in the book with chi-square table. • Since we have Chi-square as 13.31 with d.f. 4 • The corresponding P-value falls between 0.005 and 0.010. • Since (.005< P-Value < 0.010) < .05, we reject null and accept alternate. Based on 5% level of significance, we are taking a chance to conclude that keyboard arrangement and learning time are not independent.
Group Work (the situation) • Vending Machine is to install soda machines in elementary school and high school. The market analyst wish to know if flavor preference and school level are independent. A random sample of 200 students was taken. Their school level and soda preferences are given. Is independence indicated at the 1% level of significance?
How to Test for independence of two statistical variables • Look at Pg 582. Copy it and follow it!
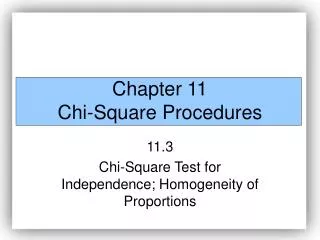
Test of homogeneity • The test claim that different populations share the sample proportions of specified characteristics.
Test of Homogeneity • The procedure is very much the same as test for independence, except the hypothesis is different. • For test of independence: • For test of homogeneity:
Example: • If you could own one pet, what kind would you choose? The possible responses were of the following. Does the same proportion of males same as females prefer each type of pet? Use 1 % level of significance
Final Answer • Chi-square= 16.059 • d.f.=3 • P-value=.001 • Based on 1% level of significance, we are taking a chance to say that males and female students have different preferences when it comes to selecting a pet because we rejected the null saying preference is the same and accept the alternate saying the preference is different.
Homework Practice • Pg 588 #1-15 even
Reason Behind Goodness of Fit • Set up a test to investigate how well a sample distribution fits a given distribution • Use observed and expected frequencies to compute the sample chi-square statistics • Find or estimate the P-value and complete the test
Sample statistic • With degrees of freedom= k-1 • E=Expected frequency • O=Observed frequency • k=number of categories in the distribution
Question • Does present distribution of favorable responses the same or different than last year? To test this hypothesis, a random sample of 500 employees was taken. The chart is on the next slide. Use 1% level of significance
Answer • K-1 = 5-1=4 • (.005<P-value<.010) < .01 • Reject null, accept alternate • At the 1% level of significance, we can say that the evidence supports the conclusion that this year’s responses to the issues are different from last years because we reject the null saying they are the same and accept the alternate, saying they are different.
Group Work • The age distribution of the Canadian population and the age distribution of a random sample of 455 residents in the Indian community (Red Lake village) • Use 5% level of significance to test the claim that the age distribution fits the age distribution of red lake village
Answer • .005<P-value<.01 • Reject null; accept alternate • ***insert conclusion***
Homework Practice • Pg 597 #1-18 even