Download
1 / 5
50 likes | 171 Vues
Lay out of the ESA for our run. 2 BPMs upstream (not showed), I got the position data from a table. 2 sets of 3 BPMs each downstream (BPM3, BPM4, BPM5 which are around 13 m, and BPM9, BPM10 and BPM11 which are around 29 m away from the wakefield box.

E N D
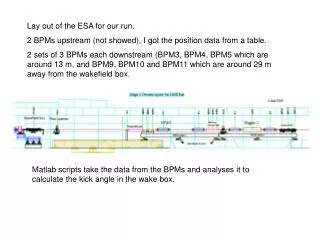
Lay out of the ESA for our run. 2 BPMs upstream (not showed), I got the position data from a table. 2 sets of 3 BPMs each downstream (BPM3, BPM4, BPM5 which are around 13 m, and BPM9, BPM10 and BPM11 which are around 29 m away from the wakefield box. Matlab scripts take the data from the BPMs and analyses it to calculate the kick angle in the wake box.
What the scripts do: • Loads reference data (beam without wake kick) from BPMs • Computes an average reference beam position • Loads data with the wake kick from the BPMs • Computes average data beam position (in various spoiler vertical positions) • Loads R-matrices (components r33 and r34 for each BPM position needed to calculate, reconstruct, the angle at the wake box): kick = R-1 x Data • Disables flaky BPMs • Analyses the tracks • A second independent script uses the data generated by the previous scripts: • Makes 3 vectors: one for the mover mean position, another for the mean kick and a last for the errors (rms) • Does the fit to the kick values at each mover position and plots it
Test performed with fake data: First create an array with positions of the mover (the spoiler vertical positions). Ydes Positions of the mover: 11 different positions with 50 pulses each. From -1 mm to 1 mm. Units in the plot: pulse # vs position in microns.
Fake data without noise (8 BPMs: 2 upstream, 6 downstream). Pulse # vs vertical displacement measured by the BPM in microns. dyp without noise (dypout-dypin) Pulse # vs recontructed angle at the wake box in microradians.
Fake data with 1um noise (8 BPMs: 2 upstream, 6 downstream). dyp with 1um noise (dypout-dypin) Very noisy results. The kick angles are “small” so for a BPM signal noise ~1 um probably will need more pulses (more than the 50 simulated here) per position to improve resolution.