Download
1 / 17
170 likes | 265 Vues
This project aims to understand solar irradiance effects and manage real-time operations for nowcasting. Results are available online every 6 hours, focusing on neutral and ion composition in the mesosphere. The software integrates various simulations and models for accurate predictions. Validation and extension to cover the ionosphere are future goals for improved usability.

E N D
Modeling and visualization software for the nowcasting of the middle atmosphere T. Egorova*, N. Hochmuth***, E. Rozanov*,**,A.V. Shapiro*,**, A.I. Shapiro*, and W. Schmutz* *PMOD/WRC, Davos, Switzerland ** IAC ETHZ, Zurich, Switzerland *** Institut für 4D-Technologien Fachhochschule Nordwestschweiz, Switzerland
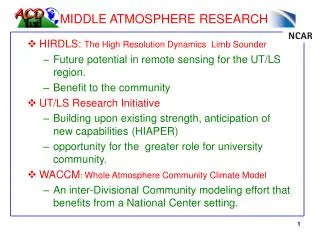
Goals of the project • Find out how well we understand the solar irradiance influence on the middle atmosphere; • Learn how to manage near-real-time operation and visualization; • At the moment Space Weather Service is a secondary goal but may become interesting
Nowcasting results available on web every 6 hours Output validation to improve the model 6-Hourly Data from observations by LYRA, PREMOS or Reconstructions Nowcast of neutral and ion composition in the mesosphere based on solar irradiance measurements Simulations of the neutral and charged species with free running CICM SOCOLi Preparation of the entire Spectral solar irradiance
MEZON MA-ECHAM4 Chemistry-Ionosphere Climate model SOCOLi Egorova et al. 2005; Schraner et al. 2008; Egorova et al. 2010 • t = 15 min for dynamics • t = 2 h for radiation • horizontal resolution: T30 (3.75°) • vertical resolution: 39 levels to 0.01 hPa CTM: Model for Evaluation of oZONe trends Rozanov et al. 1999, 2001 Egorova et al. 2001, 2003 GCM: Middle Atmosphere version of the European Center/Hamburg Model 4 Manzini and McFarlane, 1998 • t = 2 h for radiation and chemistry • 41 chemical species • Electrons, 17 negative ions 31 positive ions • Reactions: 118 gas-phase, 33 photolysis, 16 het, 500 ionic • GCM-CTM coupling by O3 , H2O, CH4, N2O, CFCs
CCM SOCOLioutput 4D: latitude, longitude, altitude, time Mixing ratio of the neutral species and electrons, negative and positive ions density for the 6 hour period after the last LYRA measurement and their statistical properties Charged components: O+, O2+, O4+, N+, NO+, N2+, H2O2+, H3O+,O2+∙N2, O2+∙H2O, H3O+∙OH, NO+∙H2O, NO+∙(H2O)2, NO+∙(H2O)3, NO+∙CO2, NO+∙N2, NO+∙H2O∙CO2, NO+∙H2O∙N2, NO+∙(H2O)2∙CO2, NO+∙(H2O)2∙N2, H+∙(H2O)2, H+∙(H2O)3, H+∙(H2O)4, H+∙(H2O)5, H+∙(H2O)6, H+∙(H2O)7, H3O+∙CO2, H3O+∙N2, H+∙(H2O)2∙CO2, H+∙(H2O)2∙N2 e¯,O¯, O2¯, O3¯, O4¯, OH¯, CO3¯, CO4¯, NO2¯, NO3¯, HCO3¯, ClO¯, Cl¯, CH3¯,O2¯∙H2O, NO3¯∙H2O, CO3¯∙H2O Neutral components: O3 , O* , O , O2*, NO, HO2, ClO, NO2 , OH, NO3, N2O5, HNO3, HONO3, ClONO2, Cl, N, N*, H2O2, H, HOCl, Cl2, Cl2O2, HCl , Br, CH2O, BrO, HBr, HOBr, BrNO3, BrCl, CH3, CH3O2, CH3O, HCO, CH3O2H, H2O, CFC-11, CFC-12, N2O, CH4, CO, H2, CBrF3
EPP: Key chemical processes GCR SPE EEP Air + particles= HOx + NOx +Ions + e- Ozone destruction by HOx H2O + hv (<200 nm) = OH + H NO + hv = NO+ + e- Ozone destruction by HOx Mesosphere Transport O2 + hv (<240 nm) = O + O O + O2 + M= O3 + M Ozone production Middle Stratosphere Ozone destruction by NOx
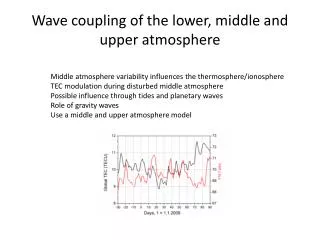
Relative deviation of the solar irradiance in Lyman- line from the 2-month mean. Compiled by J. Lean
Electron density in the tropics Solar UV SPE GCR Tropical mean time evolution (10-11.2003) of the electron concentration (cm-3). IR provided by J.-M. Wissing, AIMOS model
Maps of the electron density at 75 km during quiet time and Halloween storm.
Ozone changes due to Haloween storm SPE Funke et al.,2010a
SSI at 205 nm since 1.06.2004 Case study with CICM SOCOL: Increase SSI by ~5% The sensitivity of the OH,O3 and electrons for 2004-5 can be estimated using any of availble data sets
Comparison with observations: Hydroxyl (75 km, tropical mean) June, July and August 2004
Experimental setup for nowcasting 10-member model ensemble run for the next 6 hours Model output for the next 6 hours Spectral solar irradiance on model spectral grid for the next 6 hours Initialization fields for the next period Initial fields for 10 ensemble members
Website http://projects.pmodwrc.ch/lyra/ http://147.86.9.121/test/silver/: 10-11.2010 O3, NO, NO2, OH, H2O e-, total p+ T, den, GPH
Conclusions and outlook • Model reasonable reproduces the resposnse of the middle atmosphere to the variability of solar irradiance and particles • Visualization software is ready for operations • Validation should be extended to cover extra-polar ozone and electron density • LYRA and PREMOS solar irradiance data is not yet fully calibrated and at the moment we do not have real-time SSI data to run the model in nowcasting mode • The extention of the model to cover ionosphere will make our results more usable. • Visualization software in climate mode can be use for educational and outreach purposes.
PMOD/WRC, Davos • End of the presentation… • Thank you!!!