Test C- c ontintued
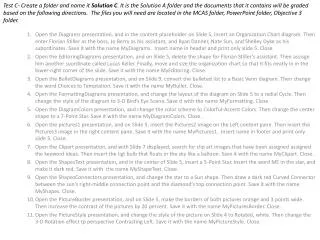
Test C- Create a folder and name it Solution C . It is the Solution A folder and the documents that it contains will be graded based on the following directions. The files you will need are located in the MCAS folder, PowerPoint folder, Objective 3 folder. .

Test C- c ontintued
E N D
Presentation Transcript
Test C- Create a folder and name it Solution C. It is the Solution A folder and the documents that it contains will be graded based on the following directions. The files you will need are located in the MCAS folder, PowerPoint folder, Objective 3 folder. Open the Diagrams presentation, and in the content placeholder on Slide 5, insert an Organization Chart diagram. Then enter Florian Stiller as the boss, Jo Berry as his assistant, and Ryan Danner, Nate Sun, and Shelley Dyke as his subordinates. Save it with the name MyDiagrams. Insert name in header and print only slide 5. Close Open the EditoringDiagrams presentation, and on Slide 5, delete the shape for Florian Stiller’s assistant. Then assisgn him another suordinate called Lucas Keller. Finally, move and size the organization chart so that it fits neatly in in the lower-right corner of the slide. Save it with the name MyEditoring. Close. Open the BulletDiagrams presentation, and on Slide 9, convert the bulleted list to a Basic Venn diagram. Then change the word Choices to Temptation. Save it with the name MyBullet. Close. Open the FormattingDiagrams presentation, and change the layout of the diagram on Slide 5 to a radial Cycle. Then change the style of the diagram to 3-D Bird’s Eye Scene. Save it with the name MyFormatting. Close. Open the DiagramColors presentation, and change the color scheme to Colorful-Accent Colors. Then change the center shape to a 7-Point Star. Save it with the name MyDiagramColors. Close. Open the pictures1 presentation, and on Slide 5, insert the Pictures2 image on the Left content pane. Then insert the Pictures3 image in the right content pane. Save it with the name MyPictures1. Insert name in footer and print only slide 5. Close. Open the Clipart presentation, and with Slide 7 displayed, search for clip art images that have been assigned assigned the keyword ideas. Then insert the ligt bulb that floats in the sky like a balloon. Save it with the name MyClipart. Close. Open the ShapesText presentation, and in the center of Slide 5, insert a 5-Point Star. Insert the word ME in the star, and make it dark red. Save it with the name MyShapeText. Close. Open the ShapesConnectors presentation, and change the star to a Sun shape. Then draw a dark red Curved Connector between the sun’s right-middle connection point and the diamond’s top connection point. Save it with the name MyShapes. Close. Open the PictureBorder presentation, and on Slide 5, make the borders of both pictures orange and 3 points wide. Then increase the contrast of the pictures by 20 percent. Save it with the name MyPicturesBorder. Close. Open the PictureStyle presentation, and change the style of the picture on Slide 4 to Rotated, white. Then change the 3-D Rotation effect tp perspective Contrasting Left. Save it with the name MyPictureStyle. Close.
Test C- contintued 12. Open the ClipArtColor presentation, and on Slide 5, recolor the image to Accent color 2 Light. Then make all the white areas of the image transparent so that the background of the slide shows through. Save it with the name MyClipArtColor. Close. 13. Open the ShapeFormatting presentation, and on Slide 6, make the image fit in a hexagonal shape. Then on Slide 4, fill the shape with the Purple Mesh texture. Save it with the name MyShapeFormatting. Close. 14. Open the SizingPictures presentation, and on Slide 2, make the three pictures all 2.5 inches high by 3.5 inches wide. Then bring the bottom picture to the top of the stack. Save it with the name MySizingPictures. Close. 15. Open the FlipDistribute presentation, and on Slide 5, flip the arrow on the right horizontally. Then distribute all the shapes evenly across the slide. Save it with the name MyFlipDistribute. Close 16. Open the GuidePosition presentation, and group the pictures on Slide 2. Then use the guides to position the upper-left corner of the top picture at the 2-inch mark on the vertical ruler and the 4-inch mark on the horizontal ruler. Save it with the name MyGuidePositions. Close. 17. Open the Charts presentation, and on Slide 7, insert a Clustered column chart. Then cut and paste the data from the text box on Slide 6 into cells A1:C5 of the Chart’s linked worksheet. (Don’t worry about the data formatting.) Resize the chart data range to include only A1:C5, and close the Excel window. Save it with the name MyCharts. Close. 18. Open the ChartElemants presentation, and on Slide 7, remove the vertical axis. Also turn off the Horizontal gridlines. Finally, move the legend to the left side of the chart, and add the title How Do You Spend Your Time? Above the chart. Save it with the name MyChartElements. Close. 19. Open the ChartType presentation, and on Slide 7, change the chart type to Stacked Column in 3-D. Format the chart by applying style 35 and layout 8. Then apply the Colored Outline—Accent 2 shape style. Save it with the name MyChartType. Close 20. Open the Tables presentation, and on Slide 5, insert a table with three columns and four rows. If you want, copy and paste the information from the text box on Slide 4 into the table on Slide 5(You will have to copy each cell seperately.) 21. Continuing in the Tables presentation, turn off Banded rows formatting, and turn on First Column formatting. Then apply the medium Style 2—Accent 2 style to the table. Save it with the name 22. Continuing in the Tables presentation, insert a row at the top of the table, and merge its cells. In the merged cell, enter and center the title Effect of Focused Activity. MyTables. Close. Note: You should have 20 files.