Download

1 / 21
210 likes | 336 Vues
c 2 Test of Independence. Hypothesis Tests Categorical Data. c 2 Test of Independence. Shows if a relationship exists between 2 categorical variables One sample is drawn Does not show nature of relationship Does not show causality Similar to testing p 1 = p 2 = … = p c

E N D
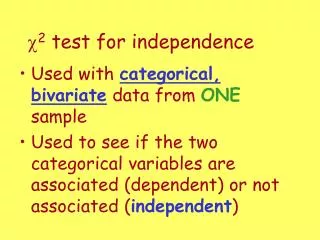
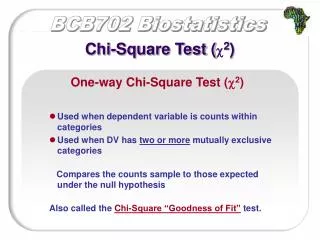
c2 Test of Independence • Shows if a relationship exists between 2 categorical variables • One sample is drawn • Does not show nature of relationship • Does not show causality • Similar to testing p1 = p2 = … = pc • Used widely in marketing • Uses contingency (XTAB) table
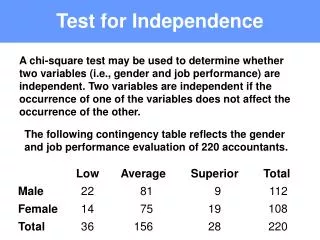
c2 Test of Independence Contingency Table • Shows # observations from 1 sample jointly in 2 categorical variables Levels of variable 2 Levels of variable 1
c2 Test of Independence Hypotheses & Statistic • Hypotheses • H0: Variables are independent • H1: Variables are related (dependent)
c2 Test of Independence Hypotheses & Statistic • Hypotheses • H0: Variables are independent • H1: Variables are related (dependent) • Test statistic Observed frequency Expected frequency
c2 Test of Independence Hypotheses & Statistic • Hypotheses • H0: Variables are independent • H1: Variables are related (dependent) • Test statistic • Degrees of freedom: (r - 1)(c - 1) Observed frequency Expected frequency Rows Columns
c2 Test of Independence Expected Frequencies • Statistical independence means joint probability equals product of marginal probabilities • P(A and B) = P(A)·P(B) • Compute marginal probabilities • Multiply for joint probability • Expected frequency is sample size times joint probability
Expected Frequencies Calculation Expected frequency = (row total*column total)/grand total 78·112160 82·112160 78·48160 82·48160
c2 Test of Independence Example You’re a marketing research analyst. You ask a random sample of 286 consumers if they purchase Diet Pepsi or Diet Coke. At the .05 level, is there evidence of a relationship?
c2 Test of Independence Solution Test Statistic: Decision: Conclusion: H0: No Relationship H1: Relationship a = .05 df = (2 - 1)(2 - 1) = 1 Critical Value(s): a = .05
Expected Frequencies Solution ü fe³ 5 in all cells 132·116286 132·154286 132·170286 154·170286
c2 Test of Independence Solution Test Statistic: Decision: Conclusion: H0: No Relationship H1: Relationship a = .05 df = (2 - 1)(2 - 1) = 1 Critical Value(s): a = .05
c2 Test of Independence Solution Test Statistic: Decision: Conclusion: H0: No Relationship H1: Relationship a = .05 df = (2 - 1)(2 - 1) = 1 Critical Value(s): Reject at a = .05 a = .05
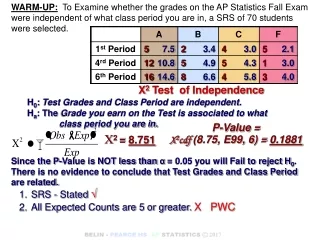
c2 Test of Independence Solution Test Statistic: Decision: Conclusion: H0: No Relationship H1: Relationship a = .05 df = (2 - 1)(2 - 1) = 1 Critical Value(s): Reject at a = .05 a = .05 There is evidence of a relationship
Alone Group Class c2 Test of Independence Thinking Challenge OK. There is a statistically significant relationship between purchasing Diet Coke & Diet Pepsi. So what do you think the relationship is? Aren’t they competitors?
You Re-Analyze the Data High Income Low Income
True Relationships* Diet Coke Underlying causal relation Apparent relation Control or intervening variable (true cause) Diet Pepsi
Moral of the Story* Numbers don’t think - People do! © 1984-1994 T/Maker Co.
This Class... Please take a moment to answer the following questions in writing: • What was the most important thing you learned in class today? • What do you still have questions about? • How can today’s class be improved?