Download
1 / 20
200 likes | 319 Vues
This guide discusses the Chi-Square test for independence, used with categorical data to determine if two variables are associated. It outlines hypotheses, assumptions, and provides practical examples, including a beef distributor's study on regional preferences and a survey on attitudes towards advertising among consumers and dentists. We explain how to calculate expected counts, degrees of freedom, and implications of P-values, guiding you to understand evidence against the null hypothesis in context.

E N D
c2 test for independence • Used with categorical, bivariate data from ONEsample • Used to see if the two categorical variables are associated (dependent) or not associated (independent)
Hypotheses – written in words H0: two variables are independent Ha: two variables are dependent Be sure to write in context!
Example 5: A beef distributor wishes to determine whether there is a relationship between geographic region and cut of meat preferred. If there is no relationship, we will say that beef preference is independent of geographic region. Suppose that, in a random sample of 500 customers, 300 are from the North and 200 from the South. Also, 150 prefer cut A, 275 prefer cut B, and 75 prefer cut C.
If beef preference is independent of geographic region, how would we expect this table to be filled in? 90 60 165 110 45 30
Assuming H0 is true, Expected Counts
Degrees of freedom Or cover up one row & one column & count the number of cells remaining!
Now suppose that in the actual sample of 500 consumers the observed numbers were as follows: Is there sufficient evidence to suggest that geographic regions and beef preference are not independent? (Is there a difference between the expected and observed counts?)
Assumptions: • Have a random sample of people • All expected counts are greater than 5. • H0: geographic region and beef preference are independentHa: geographic region and beef preference are dependent • P-value = .0021 df = 2 a = .05 • Since p-value < a, I reject H0. There is sufficient evidence to suggest that geographic region and beef preference are dependent. Expected Counts: N S A 90 60 B 165 110 C 45 30
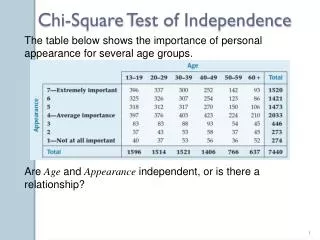
Example 6 : Suppose that residents of a particular city can watch national news on affiliates of 4 different networks: ABC, CBS, PBS and NBC. A researcher wants to know whether there is any relationship between political philosophies (liberal, moderate or conservative) and the network they watch for news. A random sample of 300 viewers was selected, and the results are given below:
Each observation consists of . We would like to test whether there is . 1. State null and alternate hypothesis
2. Calculate statistics: Expected counts: Degrees of freedom: Use the graphing calculator to calculate P-value.
c2 test for homogeneity • Used with a single categorical variable from two (or more) independent samples • Used to see if the two populations are the same (homogeneous)
Assumptions & formula remain the same! Expected counts & df are found the same way as test for independence. Only change is the hypotheses!
Hypotheses – written in words H0: the two (or more) distributions are the same Ha: the distributions are different Be sure to write in context!
Separate random samples of 124 consumers and 101 dentists were asked to respond to the following statement: “I favor the use of advertising by dentists to attract new patients.” Possible responses were strongly agree, agree, neutral, disagree, and strongly disagree. The authors were interested in determining whether the two groups – consumers and dentists – differed in their attitudes towards advertising.
Assumptions: • Have 2 random samples. • All expected counts are greater than 5. • H0: the true proportions are the same for both groups. • Ha: the true proportions differ in at least one category • P-value = .000 df = 4 a = .05 • Since p-value < a, I reject H0. There is sufficient evidence to conclude that the true proportion for the 2 groups differ.
From pollingreport.com: CNN/Opinion Research Corporation Poll. June 16, 2010. N=500 adults nationwide. MoE ± 4. "How do you feel about increased drilling for oil and natural gas offshore in U.S. waters? Do you strongly favor, mildly favor, mildly oppose or strongly oppose increased offshore drilling?"