Graphy - System of Inequalities Practice Problems
Learn how to graph systems of linear inequalities with step-by-step examples, solutions, and guided practice for better understanding. Practice and master inequalities easily!

Graphy - System of Inequalities Practice Problems
E N D
Presentation Transcript
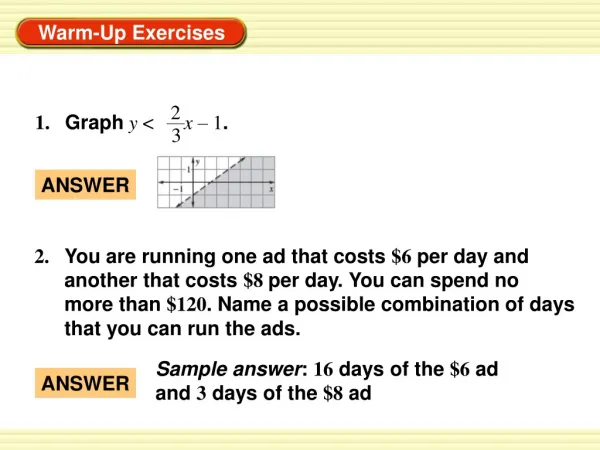
1. Graphy < x – 1. 2 ANSWER 3 Sample answer: 16 days of the $6 adand 3 days of the $8 ad ANSWER 2. You are running one ad that costs $6 per day and another that costs $8 per day. You can spend no more than $120. Name a possible combination of days that you can run the ads.
y > –x – 2 Graph the system of inequalities. Inequality 1 y 3x + 6 Inequality 2 Graph both inequalities in the same coordinate plane. The graph of the system is the intersection of the two half-planes, which is shown as the darker shade of blue. EXAMPLE 1 Graph a system of two linear inequalities SOLUTION
? ? 10 + 6 1 > 0 – 2 1 6 1 > –2 EXAMPLE 1 Graph a system of two linear inequalities Choose a point in the dark blue region, such as (0, 1). To check this solution, substitute 0 for xand 1 for yinto each inequality. CHECK
Graph the system of inequalities. y > –1 Inequality 1 x > –2 Inequality 2 x + 2y 4 Inequality 3 EXAMPLE 2 Graph a system of three linear inequalities SOLUTION Graph all three inequalities in the same coordinate plane. The graph of the system is the triangular region shown.
Graph the system of linear inequalities. 1. y < x – 4 y –x + 3 for Examples 1 and 2 GUIDED PRACTICE ANSWER
Graph the system of linear inequalities. 2. y –x + 2 y < 4 x < 3 for Examples 1 and 2 GUIDED PRACTICE ANSWER
Graph the system of linear inequalities. 3. y > –x y x – 4 y < 5 for Examples 1 and 2 GUIDED PRACTICE ANSWER
Write a system of inequalities for the shaded region. SOLUTION INEQUALITY 1: One boundary line for the shaded region is y = 3. Because the shaded region is above the solid line, the inequality is y 3. EXAMPLE 3 Write a system of linear inequalities INEQUALITY 2: Another boundary line for the shaded region has a slope of 2 and a y-intercept of 1. So, its equation is y = 2x + 1. Because the shaded region is above the dashed line, the inequality is y > 2x + 1.
ANSWER The system of inequalities for the shaded region is: y 3 Inequality 1 y > 2x + 1 Inequality 2 EXAMPLE 3 Write a system of linear inequalities
EXAMPLE 4 Write and solve a system of linear inequalities BASEBALL The National Collegiate Athletic Association (NCAA) regulates the lengths of aluminum baseball bats used by college baseball teams. The NCAA states that the length (in inches) of the bat minus the weight (in ounces) of the bat cannot exceed 3. Bats can be purchased at lengths from 26 to 34 inches. a. Write and graph a system of linear inequalities that describes the information given above. b. A sporting goods store sells an aluminum bat that is 31 inches long and weighs 25 ounces. Use the graph to determine if this bat can be used by a player on an NCAA team.
EXAMPLE 4 Write and solve a system of linear inequalities SOLUTION a. Let xbe the length (in inches) of the bat, and let ybe the weight (in ounces) of the bat. From the given information, you can write the following inequalities: x – y 3 The difference of the bat’s length and weight can be at most 3. x ≥ 26 The length of the bat must be at least 26 inches. x ≤ 34 The length of the bat can be at most 34 inches. y ≥ 0 The weight of the bat cannot be a negative number. Graph each inequality in the system. Then identify the region that is common to all of the graphs of the inequalities. This region is shaded in the graph shown.
b. Graph the point that represents a bat that is 31 inches long and weighs 25 ounces. ANSWER Because the point falls outside the solution region, the bat cannot be used by a player on an NCAA team. EXAMPLE 4 Write and solve a system of linear inequalities
4. ANSWER x ≤ 3, y> x 1 2 3 for Examples 3 and 4 GUIDED PRACTICE Write a system of inequalities that defines the shaded region.
5. y ≤ 4, x < 2 ANSWER for Examples 3 and 4 GUIDED PRACTICE Write a system of inequalities that defines the shaded region.
ANSWER x y ≤ 8, x ≥ 26, x ≤ 34, y ≥ 0 The bat can be used. for Examples 3 and 4 GUIDED PRACTICE 6.WHAT IF?In Example 4, suppose a Senior League (ages 10–14) player wants to buy the bat described in part (b). In Senior League, the length (in inches) of the bat minus the weight (in ounces) of the bat cannot exceed 8. Write and graph a system of inequalities to determine whether the described bat can be used by the Senior League player.
1. Write a system of inequalities for the shaded region. ANSWER x < 2, y > x + 1 Daily Homework Quiz
2. A bibliography can refer to at most 8 articles, at most 4 books, and at most 8 references in all. Write and graph a system of inequalities that models the situation. Daily Homework Quiz ANSWER x = articles, y = books; x 8, y4,x + y 8, x 0, and y 0