ANSWER
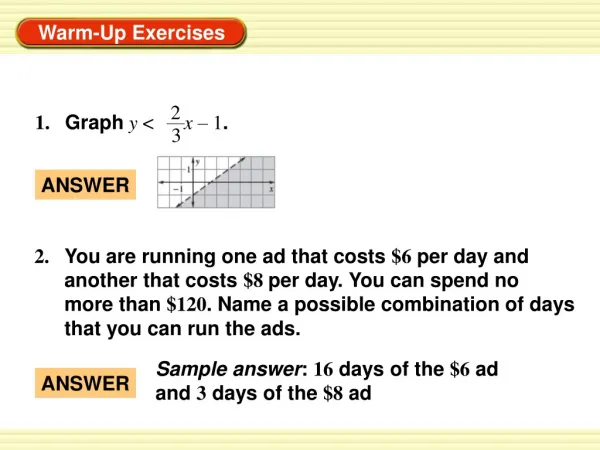
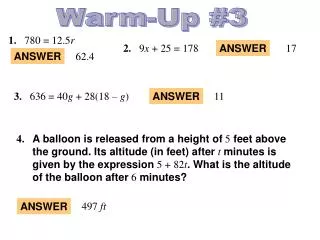
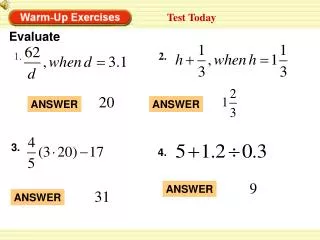
1. 1. Solve E =. 305. 1. 2. Solve 0.025 =. n. 0.057. ANSWER. 1600. ANSWER. 3. The mean score on an exam was 78 . You scored within 5 points of the mean. If x = 78 + 5 represents your possible score x on the exam, what is the range of your score?. –. 73 ≤ x ≤ 83.

ANSWER
E N D
Presentation Transcript
1 . 1. SolveE = 305 1 . 2. Solve0.025 = n 0.057 ANSWER 1600 ANSWER
3. The mean score on an exam was 78. You scored within 5 points of the mean. If x = 78 + 5 represents your possible score x on the exam, what is the range of your score? – 73 ≤ x ≤ 83 ANSWER
EXAMPLE 1 Classify samples Baseball A sportswriter wants to survey college baseball coaches about whether they think wooden bats should be mandatory throughout college baseball. Identify the type of sample described. • The sportswriter contacts only the coaches that he has cell phone numbers for in order to get quick responses. • The sportswriter mails out surveys to all the coaches and uses only the surveys that arereturned.
EXAMPLE 1 Classify samples SOLUTION • The sportswriter selected coaches that are easily accessible. So, the sample is a convenience sample. • The coaches can choose whether or not to respond. So, the sample is a self-selected sample.
EXAMPLE 2 Identify a biased sample Concert Attendance The manager of a concert hall wants to know how often people in the community attend concerts. The manager asks 50 people standing in line for a rock concert how many concerts per year they attend. Tell whether the sample is biased or unbiased. Explain your reasoning. SOLUTION The sample is biased because people standing in line for a rock concert are more likely to attend concerts than people in general.
EXAMPLE 3 Choose an unbiased sample Senior Class Prom You are a member of the prom committee. You want to poll members of the senior class to find out where they want to hold the prom. There are 324 students in the senior class. Describe a method for selecting a random sample of 40 seniors to poll. SOLUTION Make: a list of all 324 seniors. Assign each senior a different integer from 1 to 324. STEP 1
Generate: 40 unique random integers from 1 to 324 using the randInt feature of a graphing calculator. The screen at the right shows six such random integers. EXAMPLE 3 Choose an unbiased sample STEP 2 If while generating the integers you obtain a duplicate, discard it and generate a new, unique integer as a replacement. Choose: the 40 students that correspond to the 40 integers you generated in Step 2. STEP 3
for Examples 1, 2, and 3 YOU TRY • SCHOOL WEBSITE:A computer science teacher wants to know if students would like the morning announcements posted on the school’s website. He surveys students in one of his computer science classes. Identify the type of sample described, and tell whether the sample is biased. SOLUTION The computer science teacher surveys students in one of his computer science classes where students are easy to reach. So, the sample is a convenience sample. The sample is biased as the students of only the computer class are surveyed.
2. WHAT IF? In Example 3, what is another method you could use to generate a random sample of 40 students? for Examples 1, 2, and 3 YOU TRY SOLUTION Place each student’s name on a small piece of paper in a hat and draw 40 names.
In a survey of 1011 people, 52% said that television is their main source of news. EXAMPLE 4 Find a margin of error MEDIA SURVEY • What is the margin of error for the survey? • Give an interval that is likely to contain the exact percent of all peoplewho use television as their main source of news.
1 = n = 0.031 + + + + – – – – 1 The margin of error for the survey is about 3.1%. ANSWER 1011 EXAMPLE 4 Find a margin of error SOLUTION • Use the margin of error formula. Margin of error Write margin of error formula. Substitute 1011for n. Use a calculator.
It is likely that the exact percent of all people who use television as their main source of news is between 48.9% and 55.1%. ANSWER EXAMPLE 4 Find a margin of error • To find the interval, subtract and add 3.1% to the percent of people surveyed who said television is their main source of news (52%). 52% – 3.1% = 48.9% 52% + 3.1% = 55.1%
D B A The correct answer is C. ANSWER C 1 n n n + + + + – – – – 1 = 0.05 1 = 0.05 Substitute for margin error. 0.0025 = EXAMPLE 5 Use the Margin of Error Formula SOLUTION Use the margin of error formula. Margin of error Write margin of error formula. Square each side. n=400 Solve for n. There were 400 people surveyed.
3. INTERNET: In a survey of 1202 people, 11% said that they use the Internet or e-mail more than 10 hours per week. What is the margin of error for the survey? How many people would need to be surveyed to reduce the margin of error to 2%? 1 + n – = + + + + – – – – = 1 1202 0.029 The margin of error for the survey is about 2.9%. for Examples 4 and 5 YOU TRY SOLUTION Margin of error Write margin of error formula. Substitute 1202 for n. Use a calculator.
1 = 1 = 0.05 Substitute for margin error. 0.0004 = 1 n n n + + + + – – – – 0.02 ANSWER 2500 people need to be surveyed. for Examples 4 and 5 YOU TRY Use the margin of error formula. Margin of error Write margin of error formula. Square each side. n= 2500 Solve for n.
ANSWER Convenience; the sample may be biased if the same production line packed the first 5 boxes and other lines packed other boxes. KEEP GOING 1. A cafeteria buys grated cheese from a food service. The cheese is packed in boxes labeled 10 pounds. To test that the weight is correct, the cafeteria manager weighs the first 5 boxes in a recent order. a. Identify the type of sample and explain why it is biased.
ANSWER between 47.7% and 56.3%;694 boxes KEEP GOING b. In a random sample of 550 boxes, 52% weighed more than 10 pounds. Give the interval that is likely to contain the exact percent that weighed over 10 pounds. How many boxes would need to be weighed if the margin of error was 3.8%?