Understanding Venn Diagrams: Probabilities of Events in Different Scenarios
This text explains the use of Venn diagrams to illustrate probabilities involving multiple events. It presents various scenarios such as owning items (cars, air conditioners), academic subjects (history, math), and judicial outcomes (jury and judge convictions). Through specific examples and calculations, the text breaks down the relationships between events, demonstrating concepts like union, intersection, and the complement of events. The probabilities derived offer insights into how overlapping categories influence decision-making and statistical interpretation.

Understanding Venn Diagrams: Probabilities of Events in Different Scenarios
E N D
Presentation Transcript
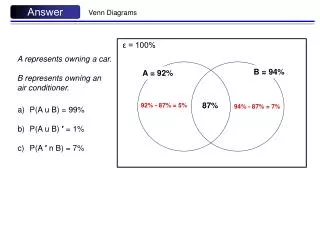
Answer Venn Diagrams ε = 100% A represents owning a car. B represents owning an air conditioner. B = 94% A = 92% 87% 92% - 87% = 5% 94% - 87% = 7% • P(A u B) = 99% • P(A u B) ′ = 1% • P(A ′ n B) = 7%
Answer Venn Diagrams ε = 100% H represents history. M represents maths. M = 50% H = 35% 35%+ 50% - 70% = 15% 35% - 15% = 20% 50% - 15% = 35% 100% - 30% = 70% H′nM′ = 30% • P(H u M) = 100% - 30% = 70% • Use P(H u M) = P(H) + P(M) – P(H n M)P(H n M) = 35% + 50% - 70% = 15% • P( only one of the subjects) = ( P(H) – P(H n M) ) + ( P(M) – P(H n M) ) • = ( 35% - 15% ) + ( 50% - 15% ) = 55%
Answer Venn Diagrams ε = 1 A = first light red B = second light red B = 0.6 A = 0.7 0.4 0.7 – 0.4 = 0.3 0.6 – 0.4 = 0.2 • P(A u B) = 0.9 • P(A u B)’ = 0.1 • P(A’ n B) = 0.2
Answer Venn Diagrams ε = 100% A = jury convicts B = judge convicts B = 73% A = 67% • P(A n B′) = 67% - 46% = 21% • P(A′ n B) = 73% - 46% = 27% • P(A n B′) + P(A′ n B) = 21% + 27%= 48% • 100% – (A u B) (A u B) = (A) + (B) – ( A n B ) • = 67% + 73% – 46% • = 94% • The percentage neither the panel nor the judge would convict = 100% – 94% = 6% 46% 67% - 46% = 21% 73% - 46% = 27% 67% + 73% – 46% = 94% 100% - 94% = 6%