Trabecular density z- scores
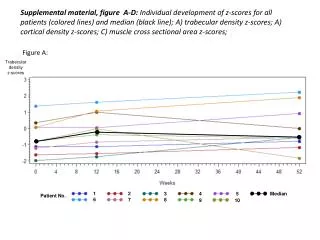
Supplemental material, figure A -D: Individual development of z-scores for all patients ( colored lines) and median (black line); A) trabecular density z-scores; A) cortical density z-scores; C) muscle cross sectional area z-scores;. Figure A:. Trabecular density z- scores.

Trabecular density z- scores
E N D
Presentation Transcript
Supplemental material, figure A-D:Individual development of z-scores for all patients (colored lines) and median (black line); A) trabecular density z-scores; A) cortical density z-scores; C)muscle cross sectional area z-scores; Figure A: Trabeculardensity z-scores Patient No. Median 1 1 2 3 5 4 6 7 8 10 9
Figure B: Corticaldensity z-scores Patient No. Median 1 1 2 3 5 4 6 7 8 10 9
Figure C: Muscle CSA z-scores Patient No. Median 1 1 2 3 5 4 6 7 8 10 9
Supplemental material, figure D-H:Individual development of bone biomarkers for all patients (colored lines) and median (black line); D) iPTH; E) 25-OH-vitamine D; F) BsaPG) C1CP; H) IGF-1; iPTH Figure D: pg/ml Patient No. Median 1 1 2 3 5 4 6 7 8 10 9
Figure E: 25-OH-VitD ng/ml Patient No. Median 1 1 2 3 5 4 6 7 8 10 9
Figure F: Bonespecificalkalinephosphatase U/l Patient No. Median 1 1 2 3 5 4 6 7 8 10 9
Figure G: C1CP ng/ml Patient No. Median 1 1 2 3 5 4 6 7 8 10 9
Figure H: IGF-1 ng/ml Patient No. Median 1 1 2 3 5 4 6 7 8 10 9