Maximizing Benefits of Advanced Metering Infrastructure (AMI) Systems
Discover significant cost benefits of AMI systems, with annual savings from system costs and operational efficiencies. Explore various AMI capabilities and deployment scenarios, along with financial perspectives to evaluate. Consider recommendations and conclusions for optimizing AMI implementations.

Maximizing Benefits of Advanced Metering Infrastructure (AMI) Systems
E N D
Presentation Transcript
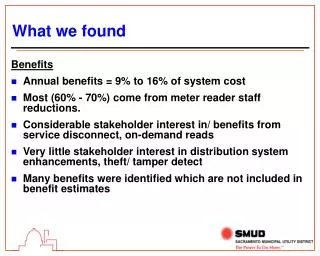
What we found Benefits • Annual benefits = 9% to 16% of system cost • Most (60% - 70%) come from meter reader staff reductions. • Considerable stakeholder interest in/ benefits from service disconnect, on-demand reads • Very little stakeholder interest in distribution system enhancements, theft/ tamper detect • Many benefits were identified which are not included in benefit estimates
What we found (continued) • Technology evolution • Several suitable, proven systems available • New features & technologies continue to emerge • AMI fixed networks still cost > $100 / point • Many utilities are expanding the use of their AMI data to obtain additional benefits • Identified most promising AMI options
AMI System Capability Summary • What we can & can’t do with AMI … Drive-by Fixed networks 1-way 2-way Monthly billing Advanced metering Monitoring & control Interactive demand response • Monthly billing • Monthly meter reads • Water/ gas reads • Advanced metering • On-demand reads • Rate choices • Tamper/ outage detect • Water/ gas reads • Remote programming • Service disconnect • Hourly data • Monitoring & control • Direct load control • End-of-line voltage monitoring • Capacitor control • Distribution automation • Wet basement alarm • Other customer services • Interactive demand response • Critical peak pricing with market responsive signals to customers • Other customer-interactive rates & services
Candidate Deployment Scenarios • Full deployments • Fixed network(FN) • Advanced 2 way FN - home automation, load control, RTP • Basic 1 or 2 way FN • Drive-by system • Partial deployments • FN for all new customers • 1-way drive-by for all new & “hard to read” customers • For all scenarios independently assess costs for- • Service disconnect • Additional load control (new devices & expanded ACLM program) • Water/ gas meter read capability
Financial Perspective • Swiftest payback • ERTs for all new service (minimal commitment) • Rapid saturation deployment (max commitment) • Should solicit business planning support for financial analyses of multi-year deployment options
Conclusions • AMI is compelling • Many mature systems exist • Significant operational benefits • Customer satisfaction, rate choices, lower rates, etc • One way radio FN’s offer the best value • All foreseen functionality at the lowest cost • Expandable, flexible • Partial deployments only make sense for high cost/ benefit groups • Rapid deployments produce fastest payback, but benefits will accrue from a staged approach • The state’s DR initiative could result in more standardization, lower cost
AMI System Unit Cost Notes Figures shown include hardware, software, installation, billing integration, training, vendor deployment support. Costs vary widely, figures shown are approximate, middle-of-range, for estimating purposes only. Actual values will vary substantially with size of project, geography, customer density, functional requirements, meter inventory, corporate strategy, and many other factors. Drive-by does not always cost less than fixed network. A power line system may be less costly than a radio system. O&M costs (not shown) vary widely and appreciably affect annual net benefit. Product status, risks, performance and other factors vary widely and often have cost & benefit consequences. Assumptions Saturation deployment. Typical mix of single-, network- and poly-phase meters. 50/50 meter retrofit/replacement. System cost ($ per meter) Drive-by (radio) ~$50 - $80 Radio Fixed Network ~$100 - $150 Power Line Fixed Network ~$110 - $170