Download
1 / 1
10 likes | 117 Vues
1.2 1.3. 2.5 2.7. 3.8 3.3. 3.7 1.7. Methodolgy to assess CH 4 emission from a tropical hydro reservoir: case of Nam Theun 2, Laos. Dominique Serça 1 , C. Deshmukh 1 , F. Becerra 2 , V. Chanudet 3 , S. Descloux 3 , P. Guédant 2 , and F. Guérin 4 ,

E N D
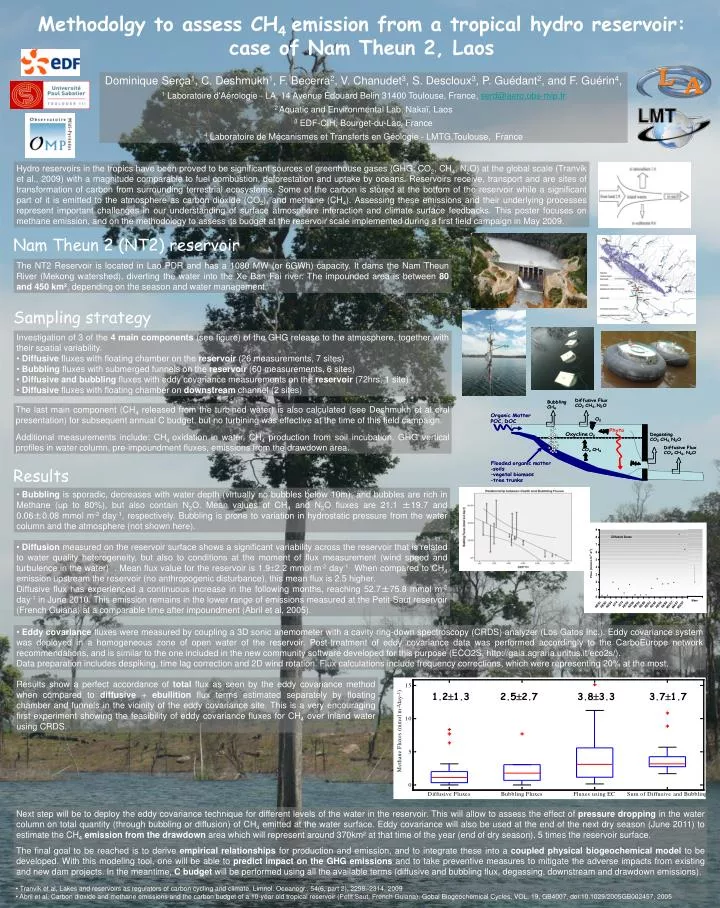
1.21.3 2.52.7 3.83.3 3.71.7 Methodolgy to assess CH4 emission from a tropical hydro reservoir: case of Nam Theun 2, Laos Dominique Serça1, C. Deshmukh1, F. Becerra2, V. Chanudet3, S. Descloux3, P. Guédant2, and F. Guérin4, 1 Laboratoire d'Aérologie - LA, 14 Avenue Édouard Belin 31400 Toulouse, France, serd@aero.obs-mip.fr 2 Aquatic and Environmental Lab, Nakaï, Laos 3 EDF-CIH, Bourget-du-Lac, France 4 Laboratoire de Mécanismes et Transferts en Géologie - LMTG,Toulouse, France Hydro reservoirs in the tropics have been proved to be significant sources of greenhouse gases (GHG: CO2, CH4, N2O) at the global scale (Tranvik et al., 2009) with a magnitude comparable to fuel combustion, deforestation and uptake by oceans. Reservoirs receive, transport and are sites of transformation of carbon from surrounding terrestrial ecosystems. Some of the carbon is stored at the bottom of the reservoir while a significant part of it is emitted to the atmosphere as carbon dioxide (CO2), and methane (CH4). Assessing these emissions and their underlying processes represent important challenges in our understanding of surface atmosphere interaction and climate surface feedbacks. This poster focuses on methane emission, and on the methodology to assess its budget at the reservoir scale implemented during a first field campaign in May 2009. Nam Theun 2 (NT2) reservoir The NT2 Reservoir is located in Lao PDR and has a 1080 MW (or 6GWh) capacity. It dams the Nam Theun River (Mekong watershed), diverting the water into the Xe Ban Fai river. The impoundedarea is between 80 and 450 km², depending on the season and water management. Sampling strategy • Investigation of 3 of the 4 main components (see figure) of the GHG release to the atmosphere, together with their spatial variability. • Diffusive fluxes with floating chamber on the reservoir (26 measurements, 7 sites) • Bubbling fluxes with submerged funnels on the reservoir (60 measurements, 6 sites) • Diffusive and bubbling fluxes with eddy covariance measurements on the reservoir (72hrs, 1 site) • Diffusive fluxes with floating chamber on downstream channel (2 sites) The last main component (CH4 released from the turbined water) is also calculated (see Deshmukh et al oral presentation) for subsequent annual C budget, but no turbining was effective at the time of this field campaign. Additional measurements include: CH4 oxidation in water, CH4 production from soil incubation, GHG vertical profiles in water column, pre-impoundment fluxes, emissions from the drawdown area. Results • Bubbling is sporadic, decreases with water depth (virtually no bubbles below 10m), and bubbles are rich in Methane (up to 80%), but also contain N2O. Mean values of CH4 and N2O fluxes are 21.1 ±19.7 and 0.06±0.08 mmol m-2 day-1, respectively. Bubbling is prone to variation in hydrostatic pressure from the water column and the atmosphere (not shown here). • Diffusion measured on the reservoir surface shows a significant variability across the reservoir that is related to water quality heterogeneity, but also to conditions at the moment of flux measurement (wind speed and turbulence in the water) . Mean flux value for the reservoir is 1.92.2 mmol m-2 day-1. When compared to CH4 emission upstream the reservoir (no anthropogenic disturbance), this mean flux is 2.5 higher. • Diffusive flux has experienced a continuous increase in the following months, reaching 52.7±75.8 mmol m-2 day-1 in June 2010. This emission remains in the lower range of emissions measured at the Petit-Saut reservoir (French Guiana) at a comparable time after impoundment (Abril et al, 2005). • Eddy covariance fluxes were measured by coupling a 3D sonic anemometer with a cavity ring-down spectroscopy (CRDS) analyzer (Los Gatos Inc.). Eddy covariance system was deployed in a homogeneous zone of open water of the reservoir. Post-treatment of eddy covariance data was performed accordingly to the CarboEurope network recommendations, and is similar to the one included in the new community software developed for this purpose (ECO2S, http://gaia.agraria.unitus.it/eco2s/). • Data preparation includes despiking, time lag correction and 2D wind rotation. Flux calculations include frequency corrections, which were representing 20% at the most. Results show a perfect accordance of total flux as seen by the eddy covariance method when compared to diffusive + ebullition flux terms estimated separately by floating chamber and funnels in the vicinity of the eddy covariance site. This is a very encouraging first experiment showing the feasibility of eddy covariance fluxes for CH4 over inland water using CRDS. Next step will be to deploy the eddy covariance technique for different levels of the water in the reservoir. This will allow to assess the effect of pressure dropping in the water column on total quantity (through bubbling or diffusion) of CH4 emitted at the water surface. Eddy covariance will also be used at the end of the next dry season (June 2011) to estimate the CH4emission from the drawdown area which will represent around 370km² at that time of the year (end of dry season), 5 times the reservoir surface. The final goal to be reached is to derive empirical relationships for production and emission, and to integrate these into a coupled physical biogeochemical model to be developed. With this modeling tool, one will be able to predict impact on the GHG emissions and to take preventive measures to mitigate the adverse impacts from existing and new dam projects. In the meantime, C budget will be performed using all the available terms (diffusive and bubbling flux, degassing, downstream and drawdown emissions). • Tranvik et al, Lakes and reservoirs as regulators of carbon cycling and climate, Limnol. Oceanogr., 54(6, part 2), 2298–2314, 2009 • Abril et al, Carbon dioxide and methane emissions and the carbon budget of a 10-year old tropical reservoir (Petit Saut, French Guiana), Gobal Biogeochemical Cycles, VOL. 19, GB4007, doi:10.1029/2005GB002457, 2005